Figure 6.
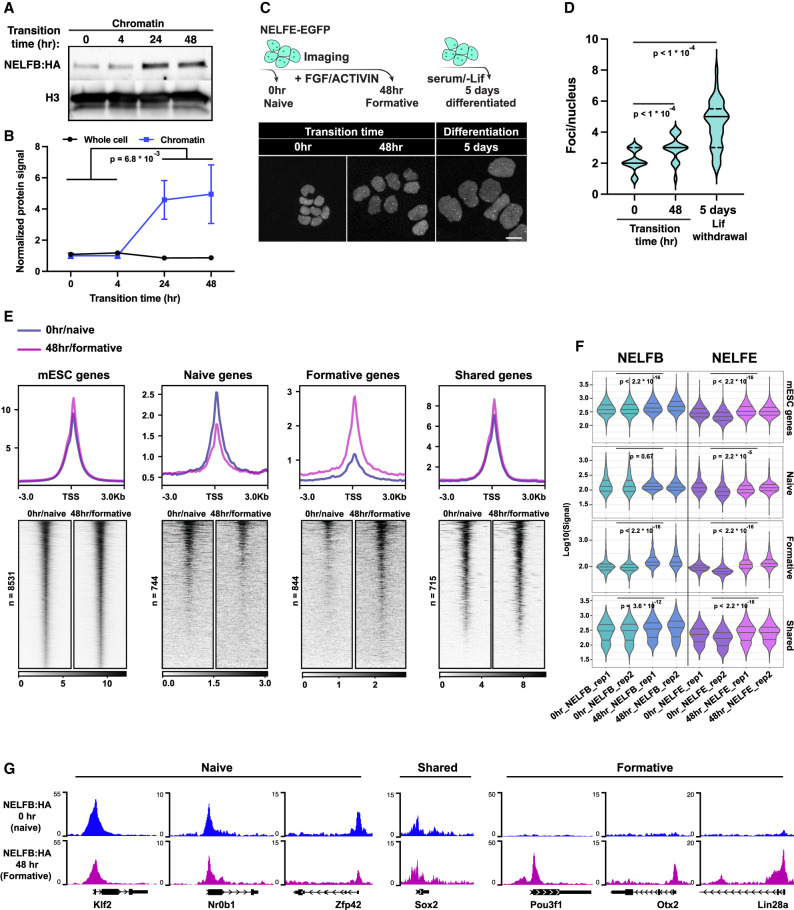
NELF is recruited to chromatin during pluripotency transitions. (A) Chromatin fraction Western blot of cells during pluripotency transitions. (B) Quantification of NELFB in chromatin and whole-cell lysates during pluripotency transitions. Statistical testing was performed using a t-test. Each time point includes two biological replicates. (C) Imaging of NELFE-EGFP in naïve, formative, and randomly differentiated mESCs. (Top) Schematic of the experiment. (Bottom) Images of select time points. (D) Violin plot of the number of NELF bodies per nucleus in conditions presented in C. Statistical testing was performed using a t-test. Mean, 25th percentile, and 75th percentile are shown inside each violin plot. (E) Heat map and metaplot of NELFB ChIP-seq signal at the promoters of select gene groups, as defined previously. (F) Quantification of cumulative NELFB and NELFE signal across replicates at each gene group shown in E. Statistical testing was performed using a Wilcoxon test. (G) Genome browser shots of candidate genes representing each group in E and F showing NELFB ChIP-seq signal.

