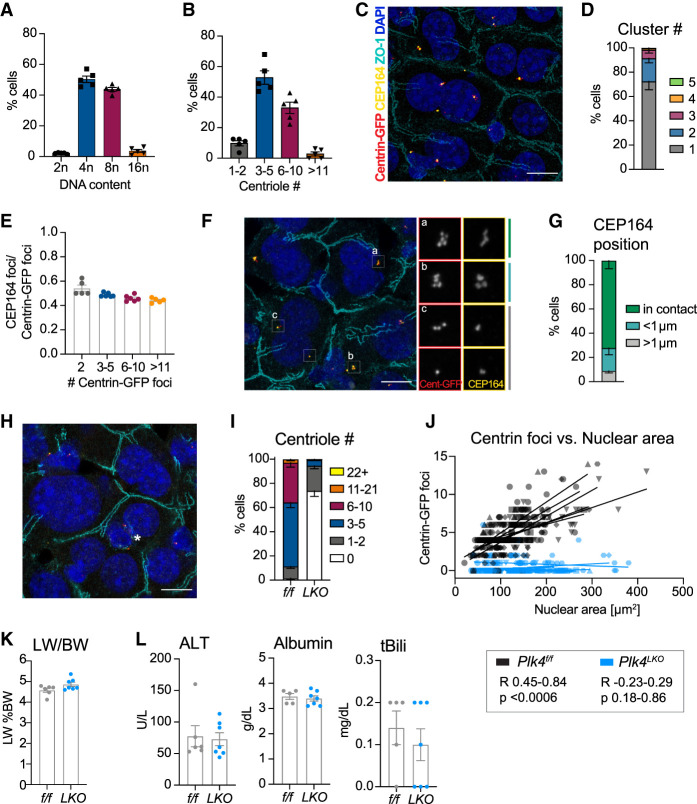
Figure 1.
Hepatocytes accumulate centrioles during polyploidization. (A) Flow cytometry analysis of hepatocyte ploidy distribution in Centrin-GFPtg/tg mice. (B) Centriole number in primary hepatocytes from A. N = 5 mice, n = 40–130 cells per mouse, age 10 wk. (C) Representative liver section from Plk4f/f; Centrin-GFPtg/tg mice. Scale bar, 10 µm. (D) Number of centriole clusters per cell quantified in liver sections. N = 6 mice, n = 40–65 cells per mouse. (E) The ratio of CEP164 foci over Centrin-GFP foci analyzed in the same liver sections as in D. (F) Representative image of centriole clusters showing examples of the orientation of distal appendages. Scale bar, 10 µm. (G) Quantification of the distance between the two closest positioned CEP164-stained appendages in a centriole cluster. (H) Representative liver section from a Plk4LKO; Centrin-GFPtg/tg mouse. Asterisk marks a nonhepatocyte cell containing centrioles. Scale bar, 10 µm. (I) Centriole number quantified by counting Centrin-GFP foci in sections from Plk4f/f; Centrin-GFPtg/tg (f/f) and Plk4LKO; Centrin-GFPtg/tg (LKO) livers. N = 6 mice, n = 31–65 cells per mouse. (J) Graph showing the correlation between the number of Centrin-GFP foci and nuclear area in Plk4f/f; Centrin-GFPtg/tg mice (Pearson R = 0.45–0.84, P < 0.0006) and Plk4LKO; Centrin-GFPtg/tg mice (Pearson R = −0.23–0.29, P = 0.18–0.86). Lines represent a linear regression calculated for each mouse. (K,L) Plk4f/f; Centrin-GFPtg/tg (f/f, n = 6) and Plk4LKO; Centrin-GFPtg/tg (LKO, n = 7) mice were analyzed for the liver to body weight ratio (LW/BW) (K) and serum concentrations of alanine transaminase (ALT), albumin, and total bilirubin (tBili) (L). All data are represented as mean ± SEM. Unpaired two-tailed Student's t-test was performed to determine statistical significance in K and L. Only significant results are indicated.

