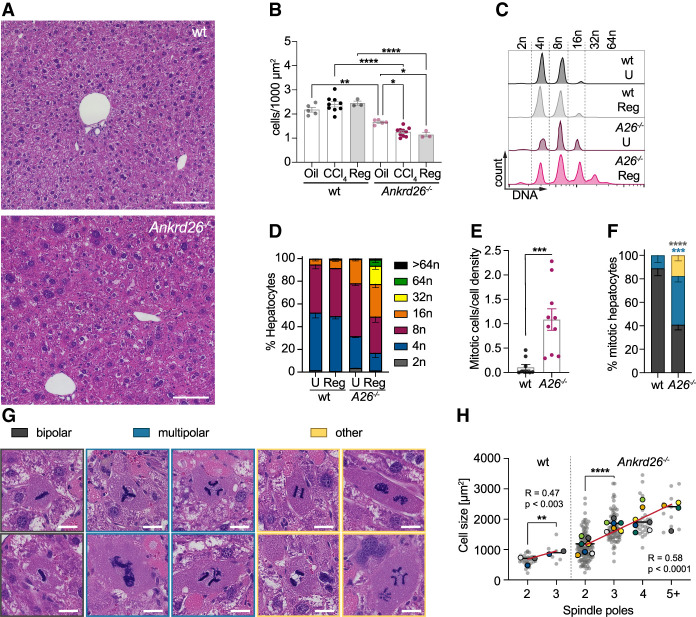
Figure 4.
ANKRD26 restricts hepatocyte polyploidy during acute and chronic CCl4 exposure. (A) H&E-stained liver sections from regenerated wt and Ankrd26−/− mice 28 d after the last CCl4 injection. Scale bar, 100 µm. (B) Cell density was assessed by hepatocyte count on H&E-stained liver sections. Mice were sacrificed 3 d (CCl4) or 28 d (Reg) after 4 wk of chronic CCl4 exposure, or 3 d after chronic corn oil treatment (Oil). For wt, oil, N = 5; CCl4, N = 9; Reg, N = 3 mice. For Ankrd26−/−, oil, N = 5; CCl4, N = 10; Reg, N = 3 mice. (C) Flow cytometry analysis of the DNA content of hepatocytes isolated from mice of the indicated genotypes after 28 d of regeneration from chronic CCl4 treatment (Reg) or untreated age-matched controls (U). (D) Quantification of the ploidy distribution described in C for wt and Ankrd26−/− (A26−/−). N = 3 mice per condition and genotype. (E) The number of mitotic hepatocytes analyzed 3 d after 4 wk of chronic CCl4 treatment. Mitotic hepatocytes were counted per area and normalized to the cell density of the respective sample. For wt, N = 9. For Ankrd26−/−, N = 10. (F) Mitotic hepatocytes quantified in E were grouped based on mitosis morphology, with examples shown in G. (Gray) Bipolar, (blue) multipolar, (yellow) other. “Other” includes hepatocytes with multiple spindles per cell, lagging chromosomes, and/or DNA bridges. Scale bar, 10 µm. (H) Graph showing the correlation between the size of mitotic hepatocytes and the number of spindle poles for each genotype. For wt, Pearson R = 0.47, P < 0.003. For Ankrd26−/−, Pearson R = 0.58, P < 0.0001. Gray dots show individual cells, and colored dots represent the average of different animals with the means shown as a line. The red line shows a linear regression. Statistical analysis was performed on all cells. For wt, N = 9 mice, n = 39 cells. For Ankrd26−/−, N = 10, n = 177. Data in B–F are represented as mean ± SEM. Statistical significance was assessed using an unpaired two-tailed Student's t-test (E,H, wt), one-way-ANOVA (B,H, Ankrd26−/−), or two-way-ANOVA (F) with Sidak's multiple comparisons test. Only significant results are indicated. (*) P < 0.05, (**) P < 0.01, (***) P < 0.001, (****) P < 0.0001.

