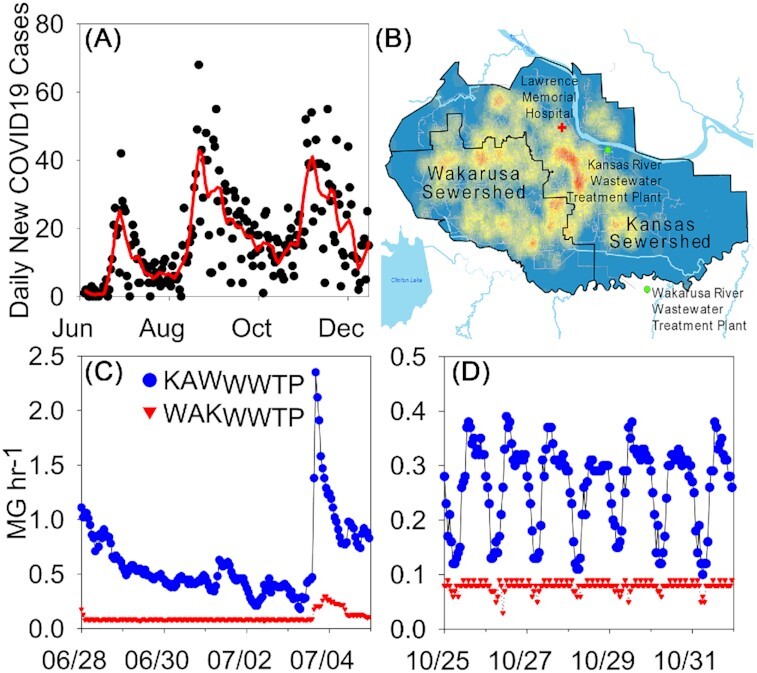
Figure 1.

(A) New daily case data with Loess smoothing curve. (B) Map outline of the Lawrence sewersheds, Wakarusa and Kansas, with case densities over the 6-month study. The map highlights the KAWWWTP, the WAKWWTP and the Lawrence Memorial Hospital. (C)Flow data (MG h−1) for the two wastewater treatment plants at a high-flow event. (D) Flow data (MG h−1) for the two wastewater treatment plants demonstrating diurnal flow pattern.
