
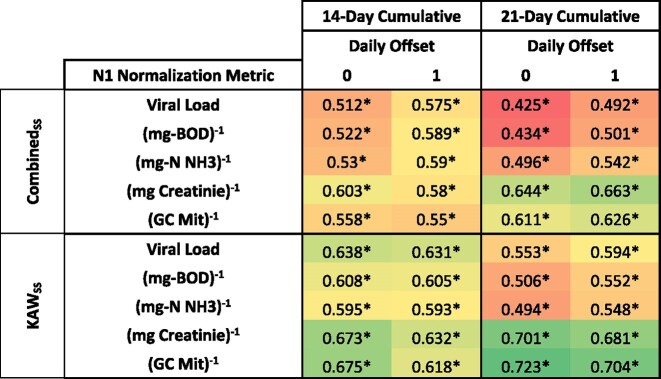
Table 1.
Select Spearman's rho values highlighting the positive correlations between SARS-CoV-2 viral load normalized by human-specific biomarkers and case data. Significant correlations (P < 0.05) are indicated by an asterisk. Coloring was used to highlight contrast in correlation coefficient (red, low; green, high) and high and low values in this table were used for the bounds.
|