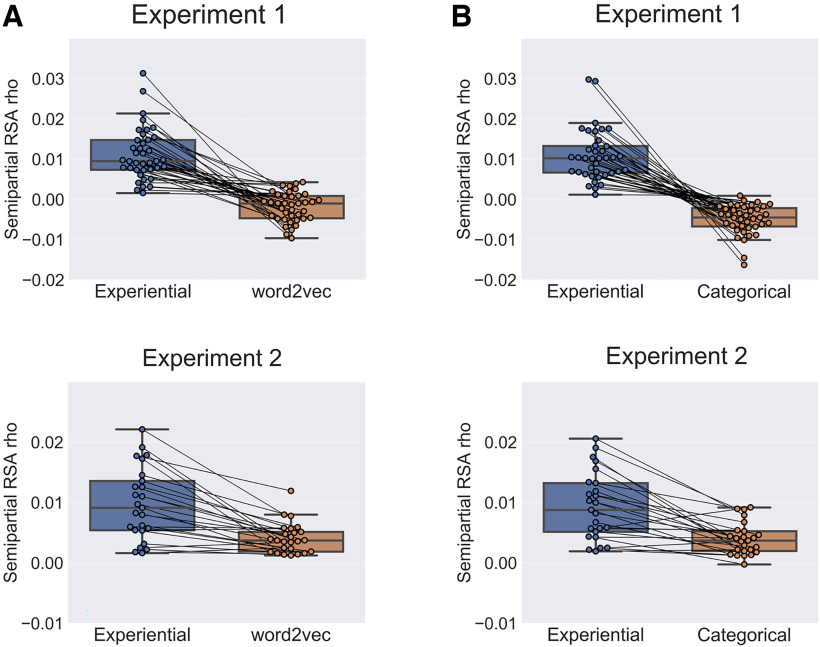
Figure 5.
A, Unique prediction performance of the multimodal experiential model and of the word2vec model relative to each other. The box plots show the mean semipartial RSA correlation for the experiential model controlling for the word2vec model (blue) and vice versa (orange), averaged across all searchlight ROIs that reached significance in the main analysis (Fig. 2, red areas at right). Each paired data point corresponds to one participant. Both experiments showed a significant advantage for the experiential model (p < 0.0001, permutation test). B, Unique prediction performance of the multimodal experiential model and of the categorical model relative to each other. The box plots show the mean semipartial RSA correlation for the experiential model controlling for the categorical model (blue) and vice versa (orange), averaged across all searchlight ROIs that reached significance in the main analysis. Both experiments showed a significant advantage for the experiential model (p < 0.0001, permutation test).

