FIGURE 1.

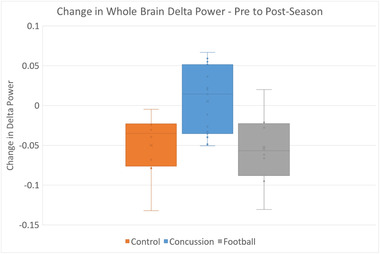
Change in delta power among groups. Based on pairwise comparisons, players with concussions had greater changes in delta wave power compared to nonconcussed players (p = .018) and controls (p = .027)

Change in delta power among groups. Based on pairwise comparisons, players with concussions had greater changes in delta wave power compared to nonconcussed players (p = .018) and controls (p = .027)