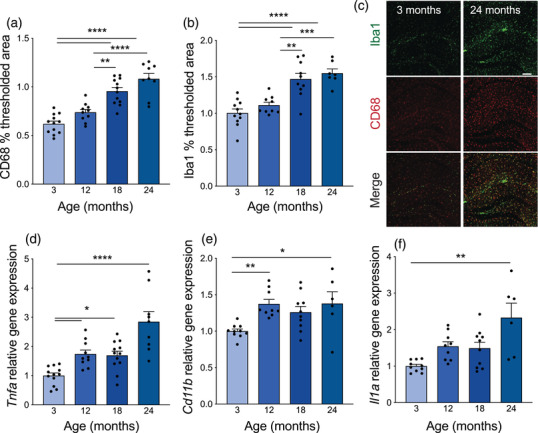
FIGURE 3.

Stepwise increase in hippocampal microgliosis and elevated proinflammatory cytokines with age. (A) Average thresholded percent area of CD68‐positive microglia in the hippocampus of mice 3–24 months of age. n = 9–12 mice per group. Nested one‐way ANOVA F = 28.96, p<0.0001, followed by Tukey's multiple comparisons test: 3 vs. 12 p = 0.1376, 3 vs. 18 ****p<0.0001, 3 vs. 24 ****p<0.0001, 12 vs. 18 **p = 0.0014, 12 vs. 24 ****p<0.0001, 18 vs. 24 p = 0.1216. (B) Average thresholded percent area of Iba1‐positive microglia in the hippocampus of mice 3–24 months of age. n = 7–11 mice per group. Nested one‐way ANOVA F = 17.94, p<0.0001, followed by Tukey's multiple comparisons test: 3 vs. 12 p = 0.5851, 3 vs. 18 **** p<0.0001, 3 vs. 24 **** p<0.0001, 12 vs. 18 **p = 0.0014, 12 vs. 24 ***p = 0.0004, 18 vs. 24 p = 0.8235. (C) Representative images from hippocampus of 3‐ and 24‐month‐old mice of Iba1 (green) and CD68 (red) microglia. Scale bar 100 mm. (D) Average hippocampal Tnfa gene expression relative to Gapdh measured by TaqMan qPCR in mice 3–24 months of age. n = 9–12 mice per group. Kruskal–Wallis test p<0.0001, followed by Dunn's multiple comparisons test: 3 vs. 12 *p = 0.0188, 3 vs. 18 *p = 0.0206, 3 vs. 24 ****p<0.0001, 12 vs. 18 p>0.9999, 12 vs. 24 p = 0.2929, 18 vs. 24 p = 0.1616. (E) Average hippocampal Cd11b gene expression relative to Gapdh measured by SYBR qPCR in mice 3–24 months of age. n = 6–10 mice per group. Kruskal–Wallis test p = 0.0024, followed by Dunn's multiple comparisons test: 3 vs. 12 **p = 0.0040, 3 vs. 18 p = 0.0983, 3 vs. 24 *p = 0.0217, 12 vs. 18 p>0.9999, 12 vs. 24 p>0.9999, 18 vs. 24 p>0.9999. (F) Average hippocampal Il1a gene expression relative to Gapdh measured by SYBR qPCR in mice 3–24 months of age. n = 6–10 mice per group. Kruskal–Wallis test p = 0.0033, followed by Dunn's multiple comparisons test: 3 vs. 12 p = 0.0788, 3 vs. 18 p = 0.2415, 3 vs. 24 **p = 0.0024, 12 vs. 18 p>0.9999, 12 vs. 24 p>0.9999, 18 vs. 24 p = 0.4666. All data are shown as mean ± s.e.m. Abbreviations: ANOVA, analysis of variance; Iba1, ionized calcium‐binding adapter molecule 1; Gapdh, glyceraldehyde‐3‐phosphate dehydrogenase; qPCR, quantitative polymerase chain reaction; Tnfa, tumor necrosis factor alpha; Il1a, interleukin 1 alpha
