FIGURE A1.

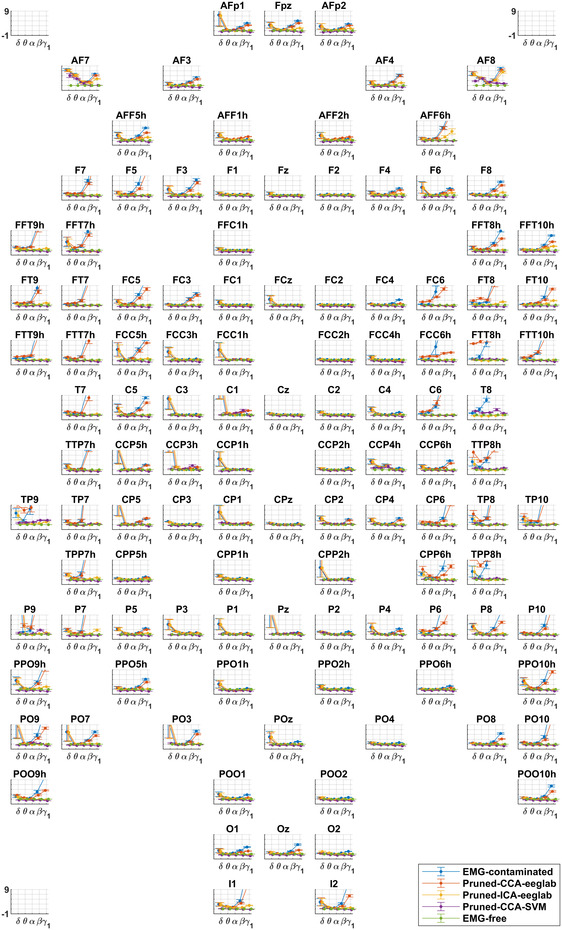
Contamination graphs for Laplacians for all 115 electrodes and the three pruning methods, to supplement information in Figure 2. The contamination scale is shown in three corners of the figure and applies to all graphs.

Contamination graphs for Laplacians for all 115 electrodes and the three pruning methods, to supplement information in Figure 2. The contamination scale is shown in three corners of the figure and applies to all graphs.