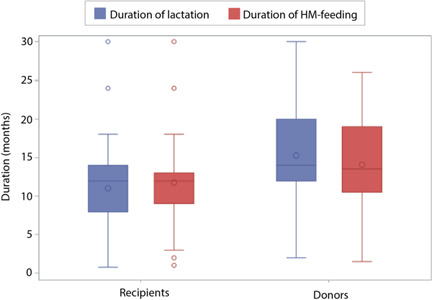
Figure 1.

Comparison of the duration of the most recent lactation and duration of human milk (HM) feeding (months) of the youngest child among HM‐sharing donors and recipients who are no longer feeding HM to their children (n = 58). The boxes represent the interquartile range containing the central 50% of values; the lines across the box represent the median values; the circles in the box represent the mean values; the whiskers represent the “minimum” (Q1 − 1.5 × IQR) and “maximum” (Q3 + 1.5 × IQR); and the circles represent outliers.
