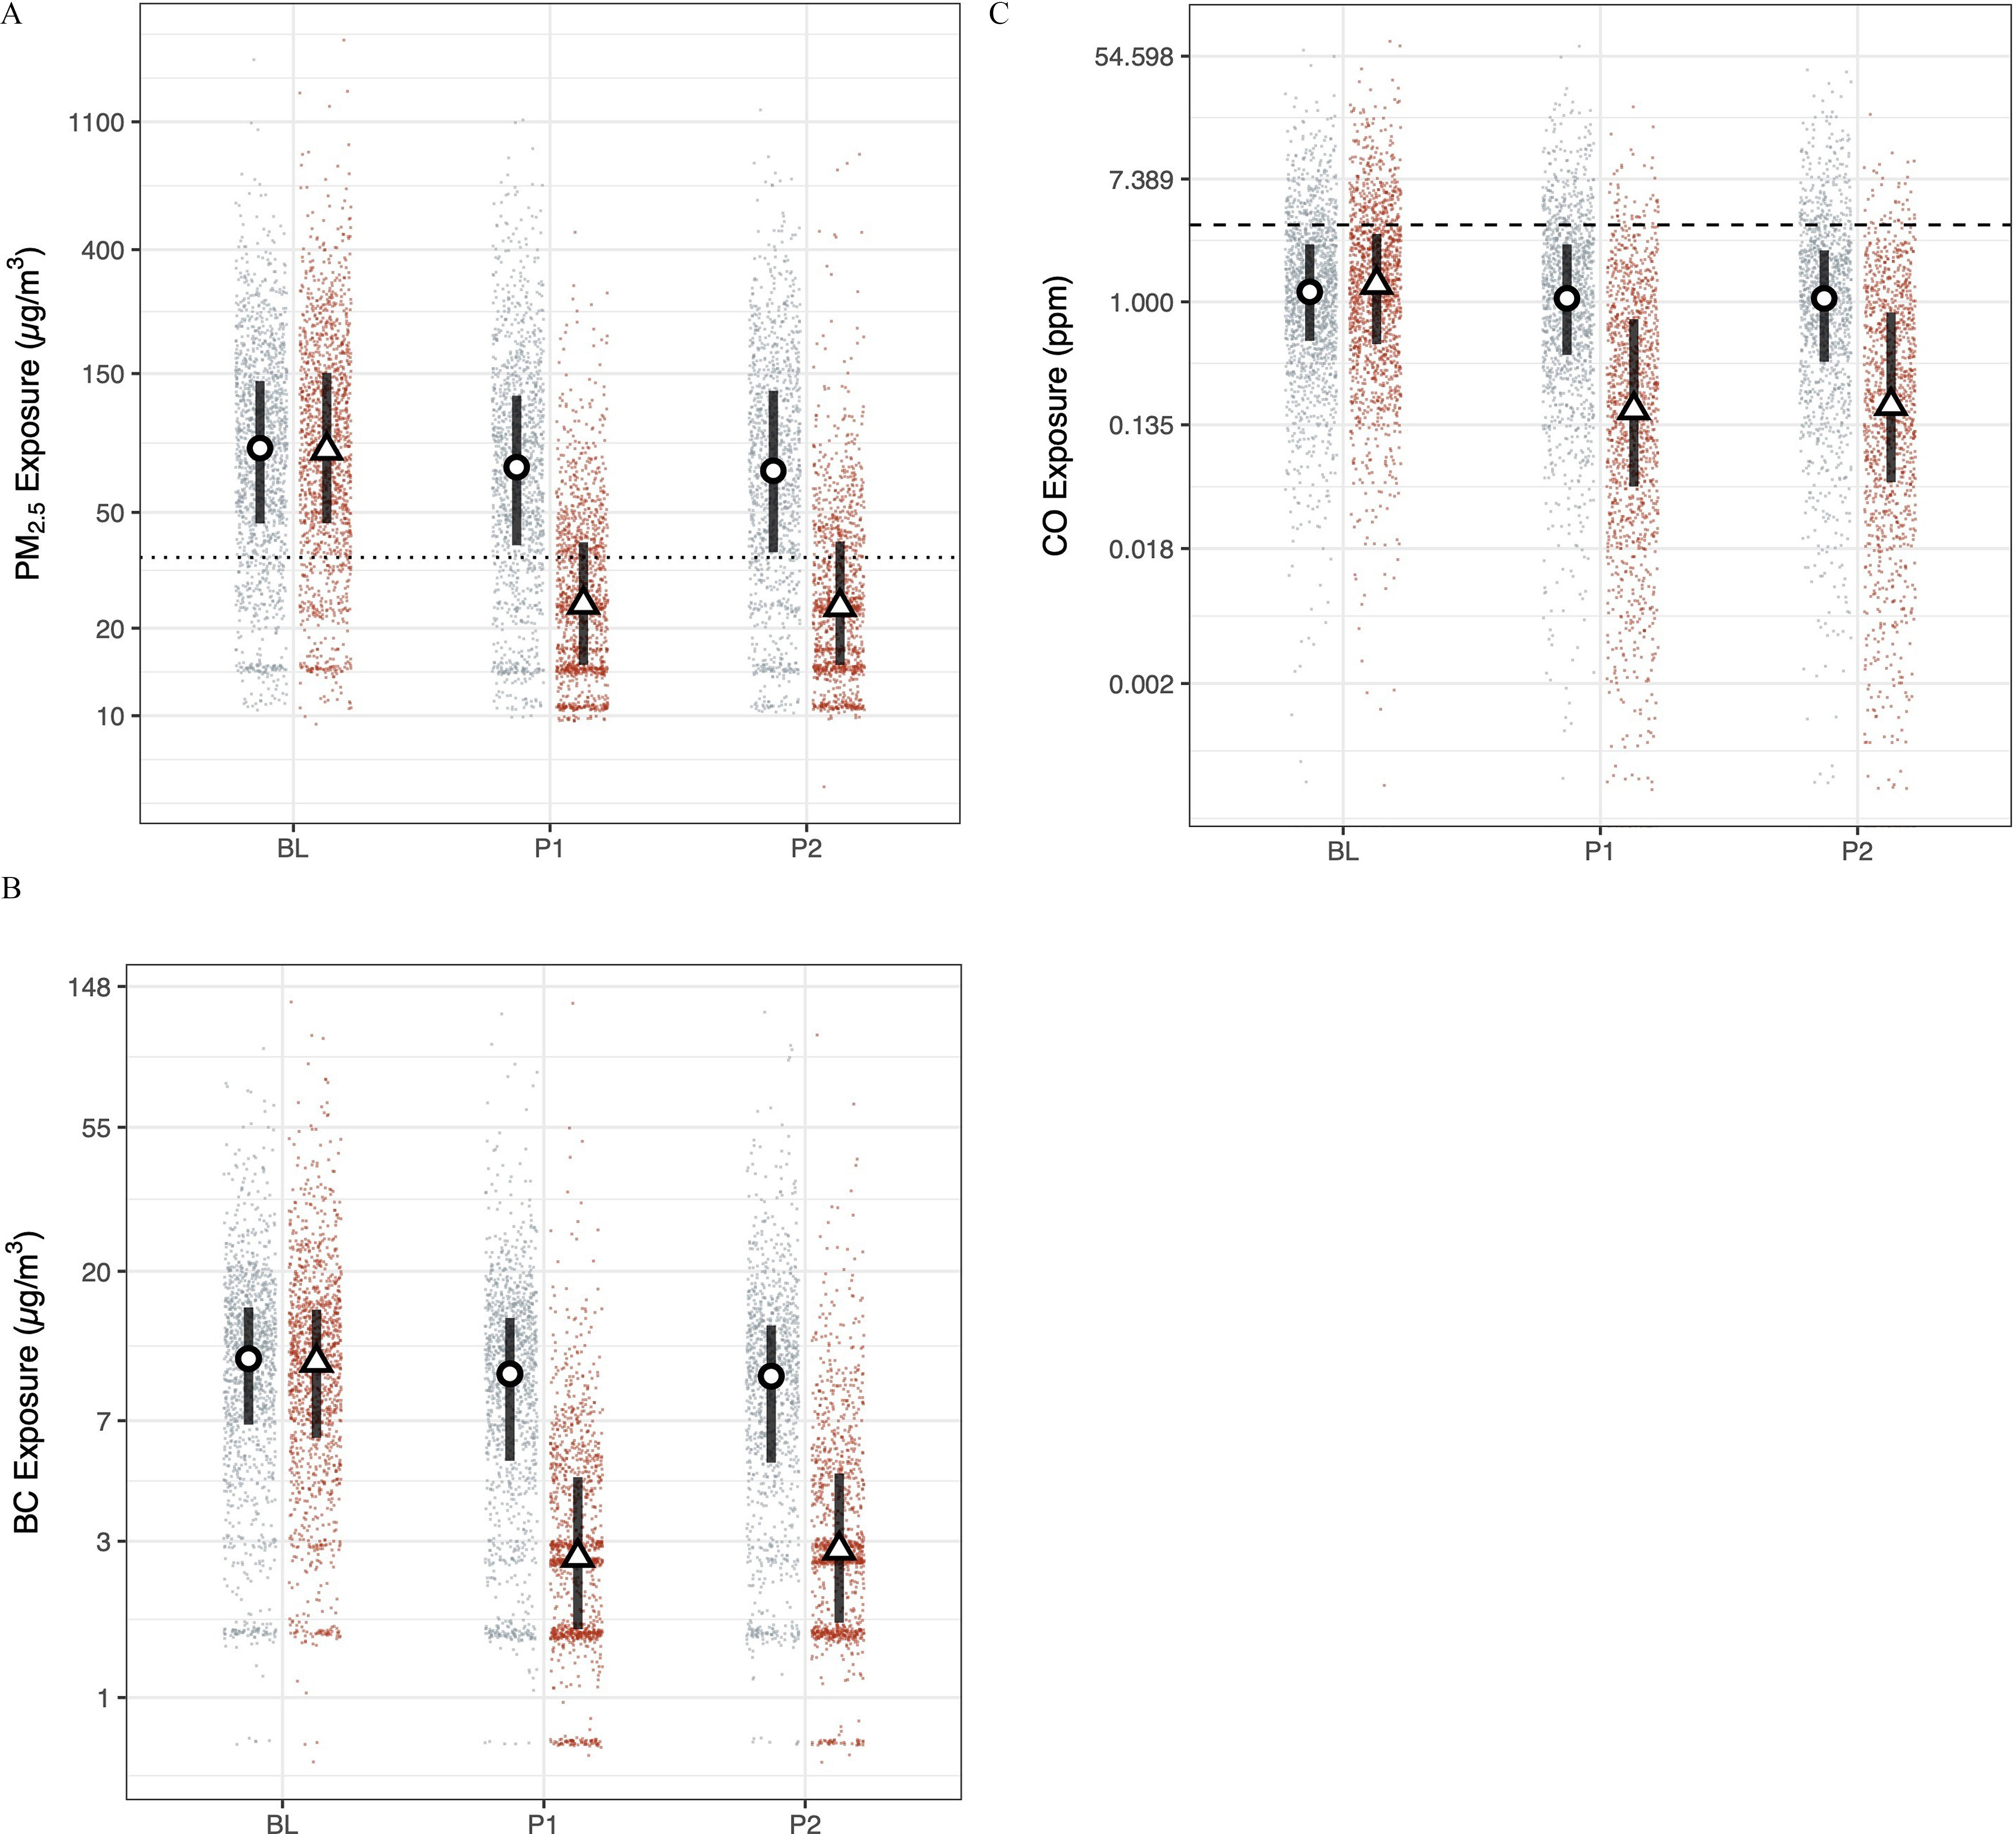
Figure 1.

HAPIN (A) , (B) BC, and (C) CO exposures. Red (right) and blue (left) dots are study round samples in intervention and control households, respectively. Circles and triangles outlined in black are median values in control and intervention households, respectively. Lines are interquartile ranges. (9–20 wk gestation; , ), (24–28 wk gestation, , ), and (32–36 wk gestation, , ). The dotted line in the particulate matter (PM) panels is the annual WHO Interim Target 1 guideline value (); the dashed line in the CO plots is the WHO guideline value of (). Numeric values corresponding to this figure are found in Table 2. Note: BC, black carbon; CO, carbon monoxide; PM, particulate matter; WHO, World Health Organization.
