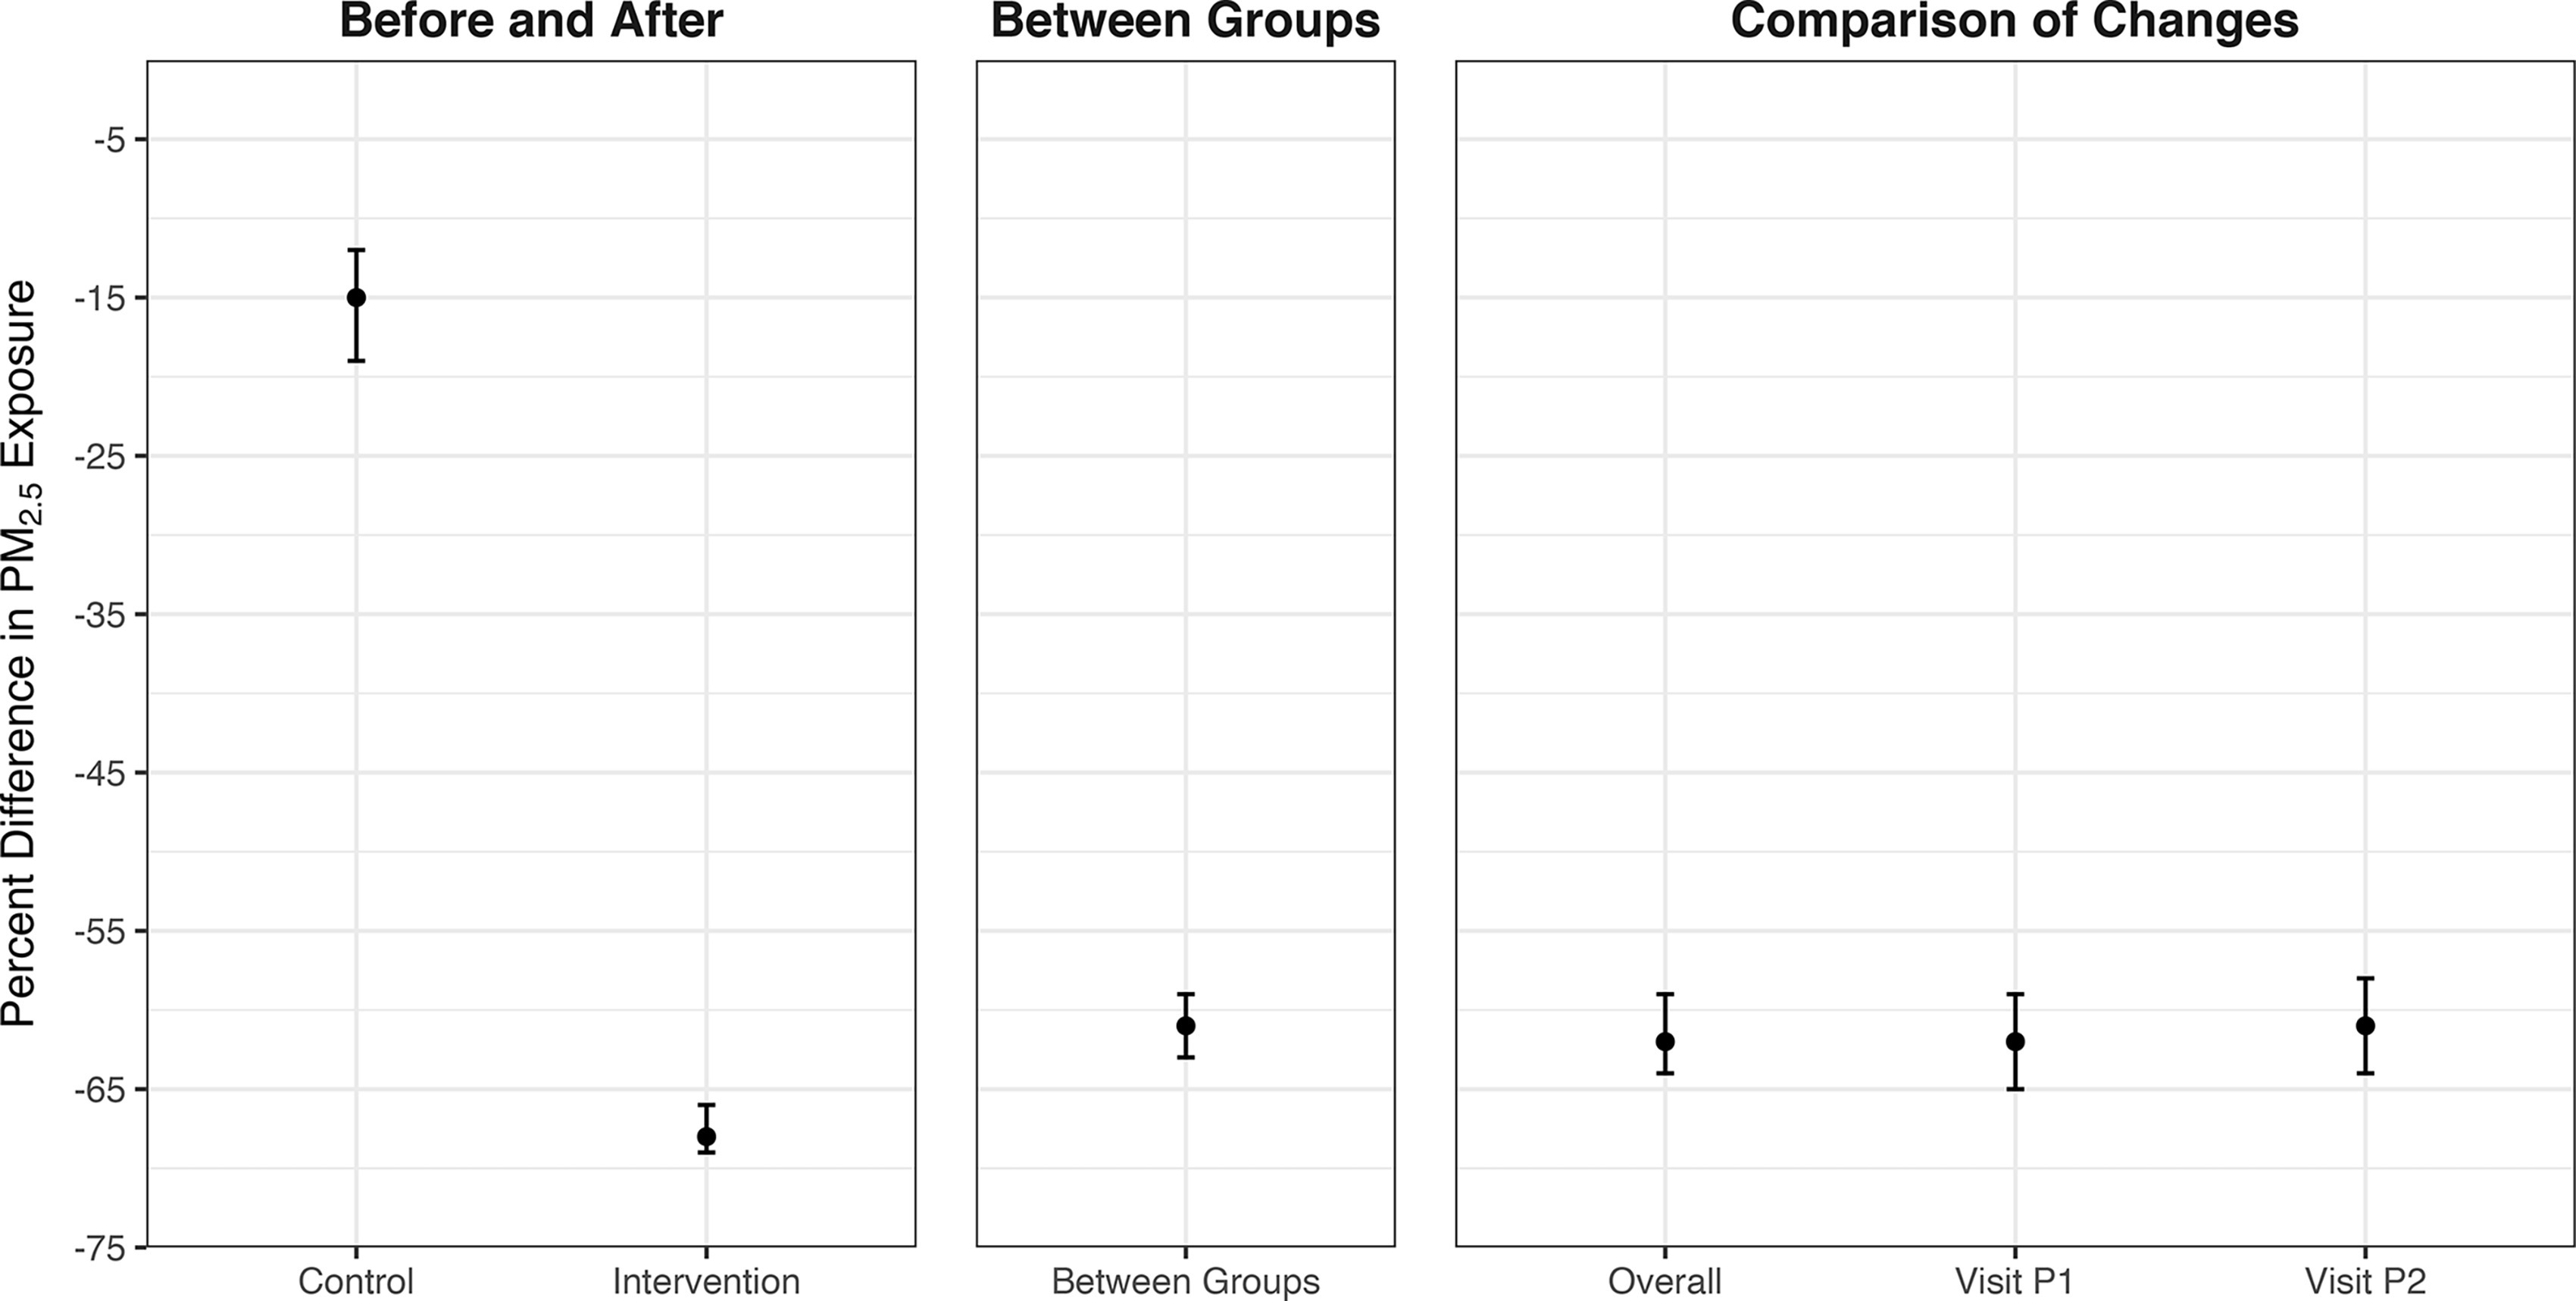
Figure 3.

Estimated impacts of the HAPIN LPG intervention on exposure. All linear mixed-effects models had log-transformed as the dependent variable. Whiskers are 95% confidence intervals. The first panel (“Before and After”) uses data from both the control and intervention arms and compares the intervention period to the baseline period. The second panel (“Between Groups”) uses only data from the intervention period and contrasts the intervention arm with the control arm. The third panel (“Comparison-of-Changes”) uses all data from both study arms and both study periods; the model term of interest is the interaction between study arm and period, after controlling for each variable separately in the model. The “Overall” points consider an average postintervention exposure; the Visit-specific points consider each postrandomization visit separately. Numeric values corresponding to this figure are found in Table 3. Note: HAPIN, Household Air Pollution Intervention Network; LPG, liquefied petroleum gas.
