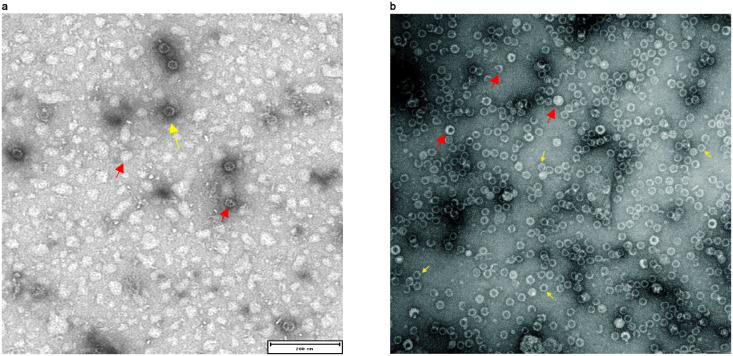
Fig 6. Negative staining transmission electron microscopy (NSTEM) analysis of HBcAg (A) and encapsulin (B) NPs exposing βBarrel in the loop.
Yellow arrows indicate correctly assembled NPs. Red arrows indicate incorrectly structured NPs like aggregates, NPs partially structured or NPs with unexpected size or geometry. Scale bars inserted in the pictures correspond to 200nm (A-B).

