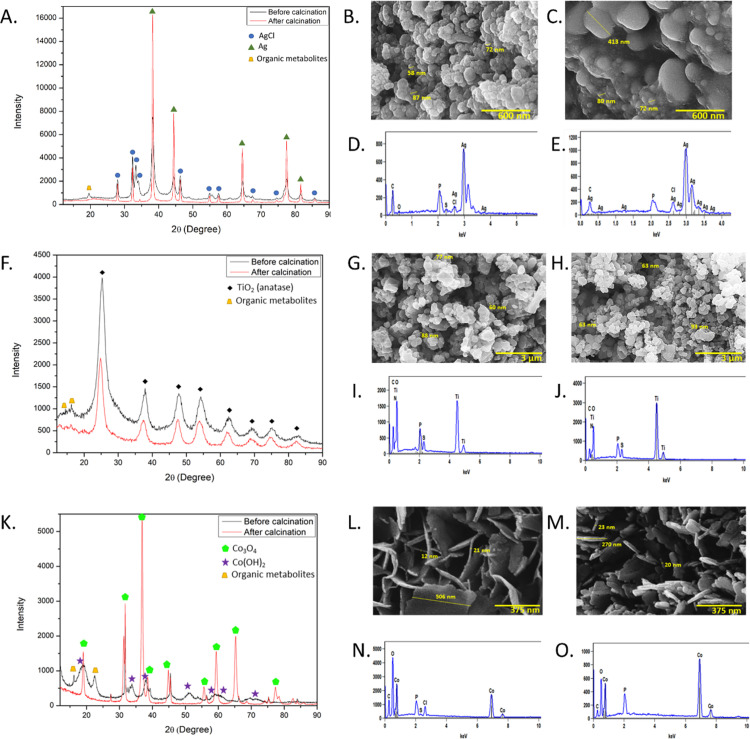
Fig 4. Crystallographic and microscopic studies of prepared nanomaterials.
(A) XRD spectrum of Ag NPs, (B) SEM image of Ag NPs before calcination, (C) SEM image of Ag NPs after calcination, (D) EDX of Ag NPs before calcination, (E) EDX of Ag NPs after calcination, (F) XRD spectrum of TiO2 NPs, (G) SEM image of TiO2 NPs before calcination, (H) SEM image of TiO2 NPs after calcination, (I) EDX of TiO2 NPs before calcination, (J) EDX of TiO2 NPs after calcination, (K) XRD spectrum of Co(OH)2 NM and Co3O4 NM, (L) SEM image of Co(OH)2 NM (before calcination), (M) SEM image of Co3O4 NM (after calcination), (N) EDX of Co(OH)2 NM (before calcination), (O) EDX of Co3O4 NM (after calcination).

