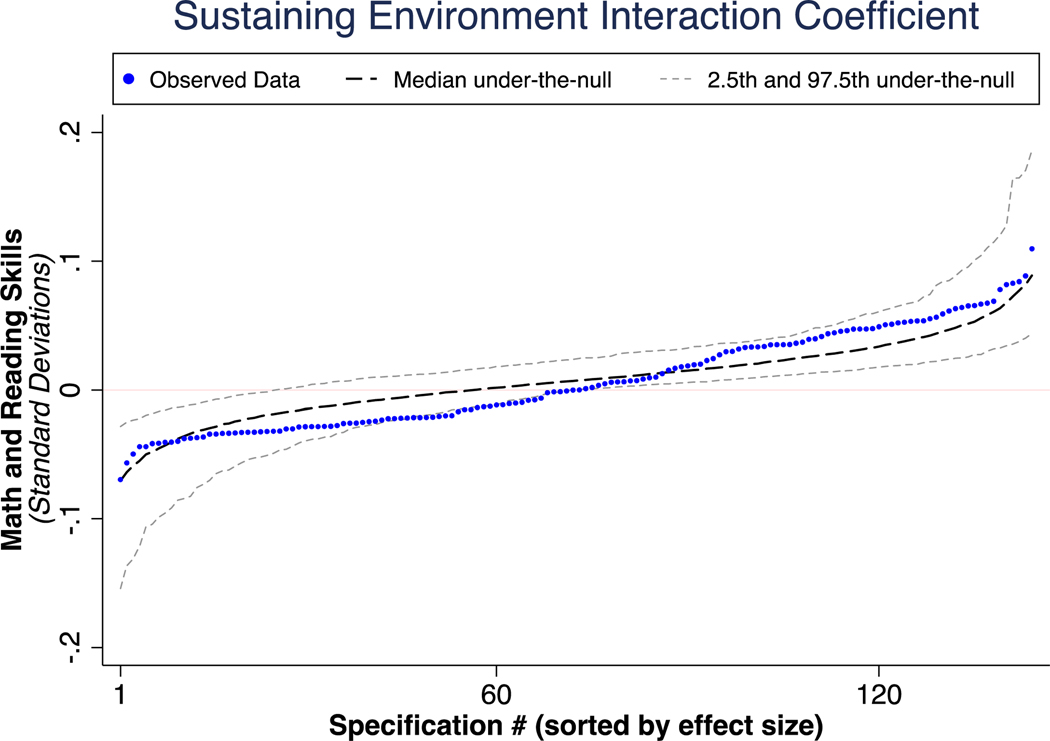
Figure 6.
Inferential Specification Curve
Note. All specifications are estimated on each shuffled sample. The resulting estimates for each shuffled dataset are ranked from smallest to largest. The dashed lines depict the 2.5th, 50th, and 97.5th percentiles for each of these ranked estimates. The blue dots are the specification curve for the observed data.

