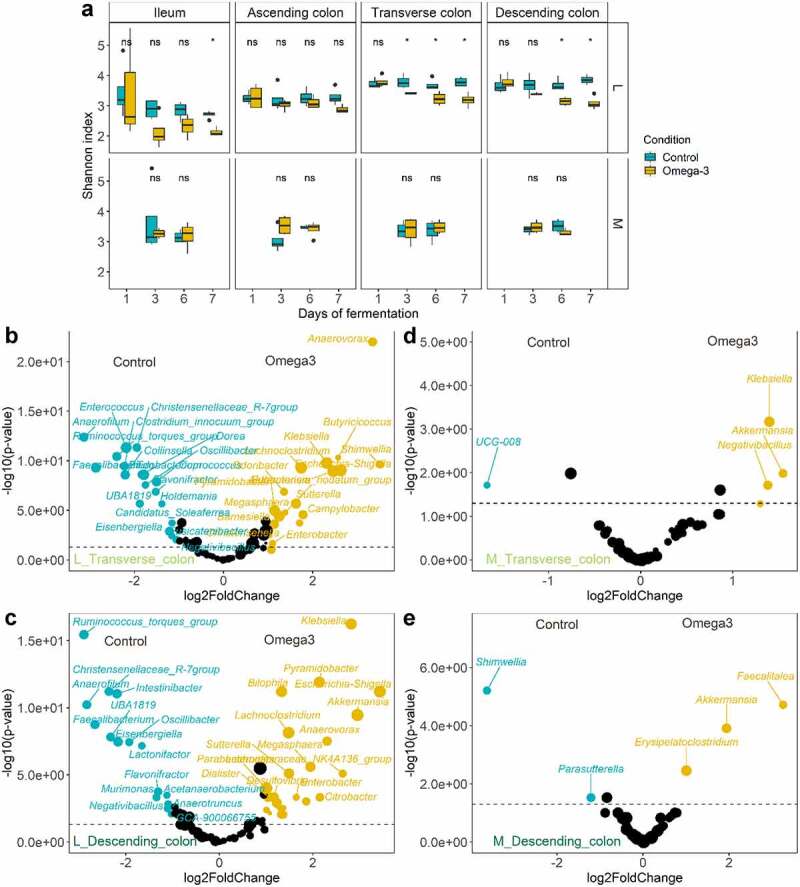
Figure 2.

Contrasting response to ω-3 supplementation between luminal/mucus-associated microbiota in the M-SHIME®. (a) Evolution of Shannon diversity index following a 1-week control versus 1-week ω-3 supplementation across the successive gut habitats/niches (n = 4 replicates). * represent the p < .05 significant differences with control based on Wilcoxon Rank Sum tests with Holm’s correction (α = .05). (b-e) Volcano plots indicating the genera significantly enriched by the ω-3 supplementation in the transverse (b and d) and descending (c and e) gut habitats of the luminal and mucosa-associated (m) niches of the M-SHIME®. A positive log2 fold-change indicates a stimulation of the genus under the ω-3 supplementation period (in Orange) while a negative log2 fold-change indicates a decrease of the genera compared to the control period (in blue), as determined by Deseq2 analysis. Statistical differences between the control and ω-3 PUFA supplementation across gut habitats were determined using a Wald Test. The log transformed adjusted p-value is displayed on the y-axis and the α = .05 significance level is indicated by a dashed line.
