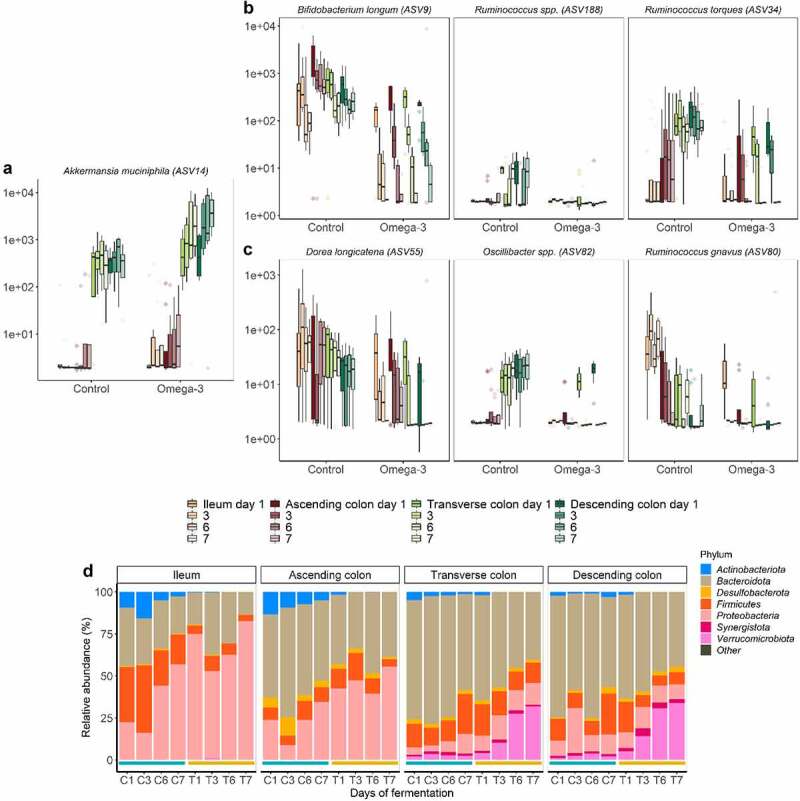
Figure 3.

Mucolytic bacteria of luminal floating mucin habitats dynamically shifted following the ω-3 supplementation. (a-c) Selection of mucolytic bacteria that displayed significant differences in ASVs level abundance between control and ω-3 supplementation, as assessed by DESeq2 analysis in the different gut habitats and over time (gradient of colors). Statistical differences between the control and ω-3 PUFA supplementation across gut habitats were determined using a Wald Test. (d) Phylum level relative abundance of the luminal microbiota composition following a 1-week control (C) versus 1-week treatment (T) across the successive gut habitats. Control and treatment conditions are demarcated in blue and Orange lines, respectively. The barplots represent the mean composition of four replicates.
