
Figure 7.
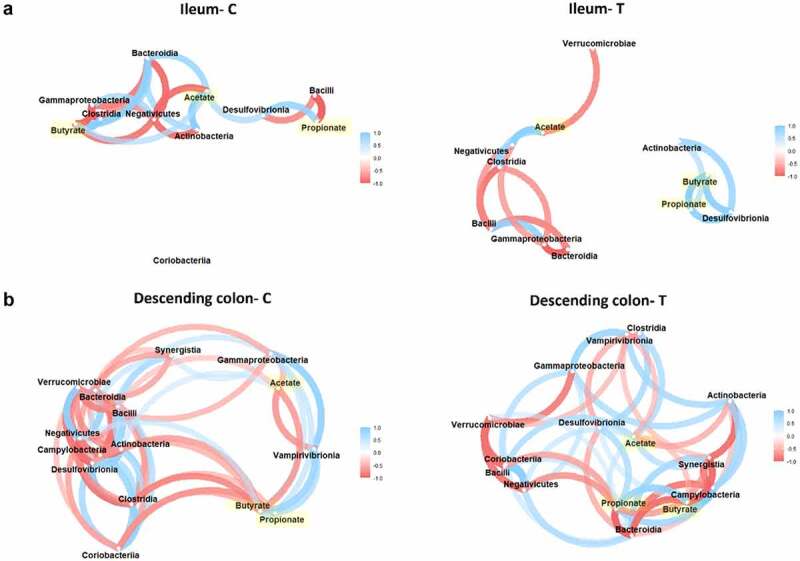
Associations between class taxa and SCFA concentrations in habitats and treatment-dependent fashion. Correlation networks illustrating the Spearman correlations between the SCFA produced under control (c) vs. ω-3 supplementation (t) and their corresponding class enrichment in opposed environments displayed in the luminal ileum (a) and descending colon (b). Gradient color, distance, and thickness of the lines were applied to nodes depending on coefficients of correlation. Only significant nodes that are upper to a coefficient of correlation of 0.5 or −0.5 are shown. Negative and positive correlations are denoted in shades of red and blue, respectively. SCFA nodes are highlighted in yellow.