
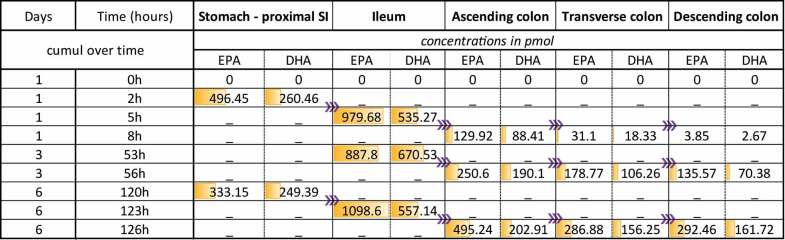
Table 2.
Spatial-temporal fate of EPA/DHA during M-SHIME® fermentation. Concentrations of EPA and DHA as free acids in each gut habitat cumulated over 1 week supplementation is indicated in pmol and gradual amount is illustrated in Orange. EPA and DHA levels are depicted in Orange. T0h refers to the sampling time point before the addition of EPA-DHA in the stomach vessel, deprived of microbiota. Only ileum and colon habitats harbor microbes. Purple arrows indicate the transfer between vessels: stomach and ileum fully empty their contents to follow a given transit time, while colon vessels partially empty their contents to follow a given hydraulic residence time. SI = small intestine.
 |