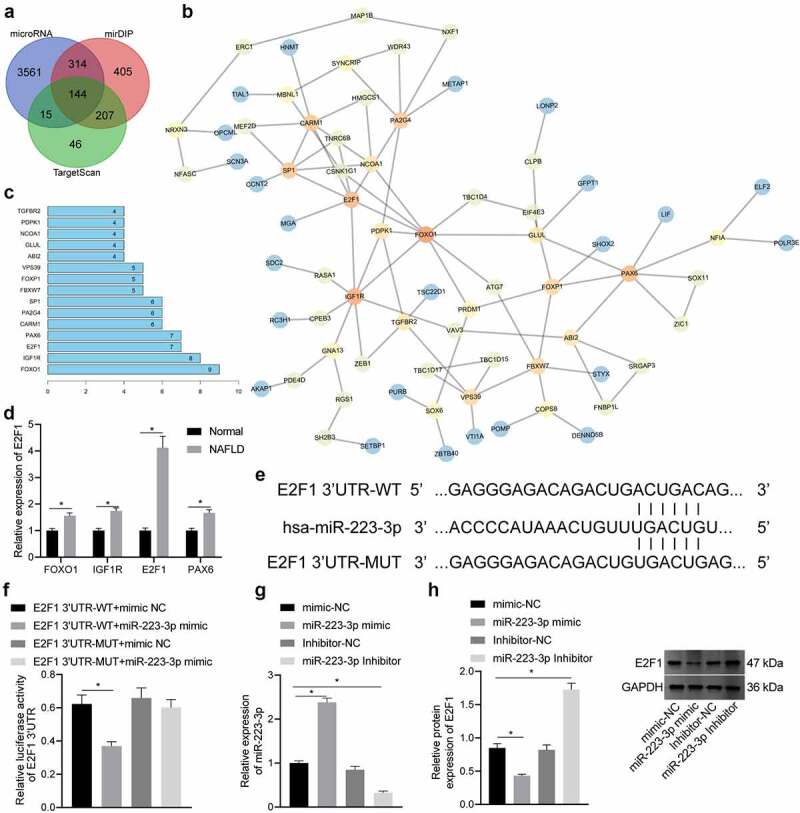
Figure 4.

E2F1 is targeted and negatively regulated by miR-223-3p. a, Prediction results of downstream gene of miR-223-3p, wherein the three circles in the panel represent the prediction results of the miR-223-3p downstream genes from the three databases, and the middle part represents the intersection of the three sets of data. b, The interaction analysis of candidate genes. Each circle represents a gene, and the line between the circles indicates an interaction relationship between genes. The darker colour indicates higher core value. c, The core degree of the candidate genes, wherein the x-axis indicates the core degree value, and the y-axis indicates the name of the top 15 genes with the highest core degree value. d, The expression of FOXO1, IGF1R, E2F1 and PAX6 in normal liver and NAFLD liver tissues determined by RT-qPCR. e, The binding site between miR-223-3p and E2F1. f, The binding of miR-223-3p and E2F1 verified by dual-luciferase report gene assay. g, The expression of miR-223-3p in NCTC1469 cells after transduction determined by RT-qPCR. h, The protein level of E2F1 in NCTC1469 cells after transduction determined by Western blot analysis. Measurement data are expressed as mean ± standard deviation, * p < 0.05. Data comparison between two groups was analysed by independent t test, and comparison among multiple groups was analysed by one-way ANOVA followed by Tukey’s post hoc test, and the cell experiment was repeated three times.
