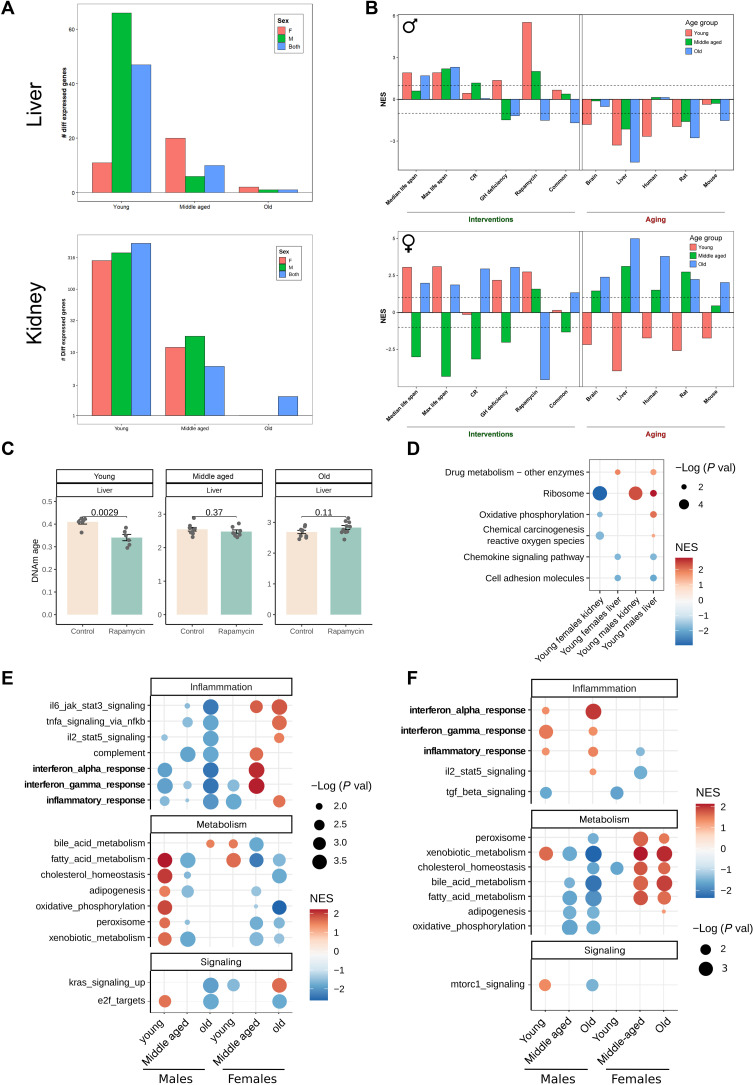
Fig. 4. Rapamycin treatment during development attenuates aging of the transcriptome and DNA methylation (DNAm) of young animals, with males preserving these younger transcriptomes across the life span.
(A) Number of differentially expressed genes (DEGs) [false discovery rate (FDR) < 0.1] in the liver and kidney of young, middle-aged, and old animals treated with EL rapamycin and compared to controls. (B) Association between gene expression changes induced by EL rapamycin and measured in young (red), middle-aged (green), and old (blue) animals, and signatures of aging and life span extension in males (top plot) and females (bottom plot). The intervention signatures include gene signatures of individual interventions [caloric restriction (CR), growth hormone (GH) deficiency, and rapamycin), common gene expression signatures across different interventions (common), and signatures associated with the effect of interventions on maximum or median life span (max and median life span). Aging signatures include age-related gene expression changes across different tissues of humans, mice, and rats (human, mouse, and rat) as well as liver- and brain-specific changes (liver, brain). (C) DNAm age of livers estimated by the Liver epigenetic aging clock in young, middle-aged, and old treated and untreated animals. P values are calculated with a two-tailed Student’s t test. (D) GSEA for pathways from the KEGG database using ranked DEGs in livers and kidneys from young treated animals. Only significant enrichments (FDR < 0.1) for at least two conditions are shown. Dots are colored according to normalized enrichment score (NES) and sized according to −log10 of P value. (E) GSEA for hallmark pathways from the MSigDB using ranked differentially expressed and (F) differentially methylated genes in treated animals. Only significant enrichments (FDR < 0.1) for at least two conditions are shown. Dots are colored according to NES and sized according to −log10 of P value.

