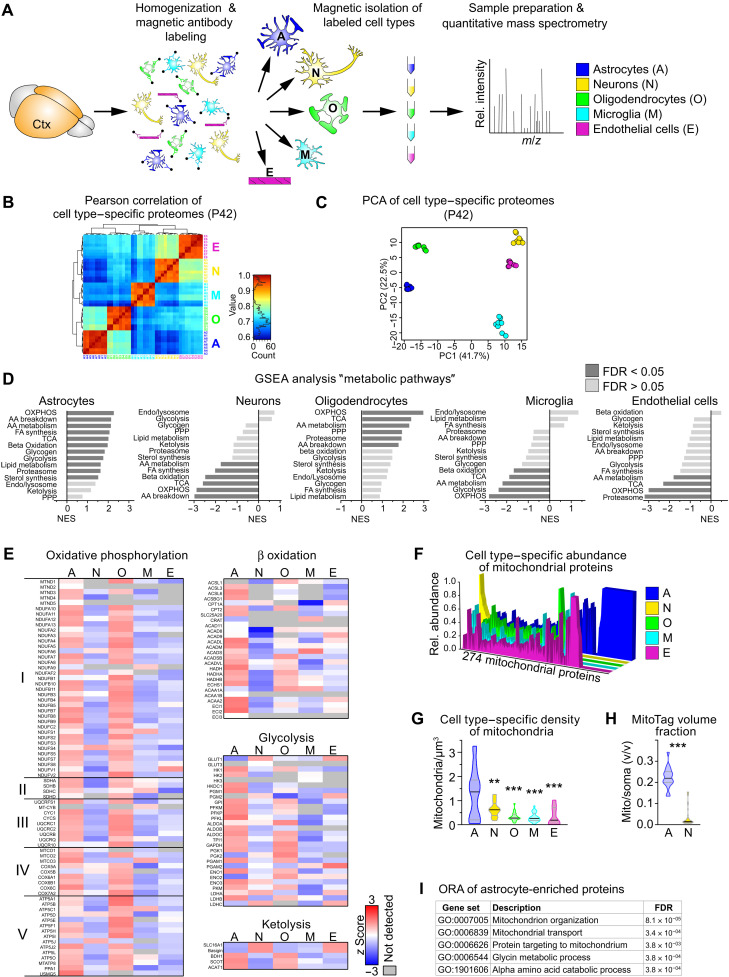
Fig. 1. Preferred metabolic pathways in cortical cell types.
(A) Scheme of the experimental approach. Cell types were isolated from the cortex (Ctx) of individual P42 mice (n = 4) using magnetic beads and analyzed by proteomic profiling. m/z, mass/charge ratio. (B) Pearson correlation of cell type–specific proteome datasets as in (A). (C) PCA of cell type–specific proteomes calculated from 722 complete cases of a total of 3541 proteins. (D) Normalized enrichment score (NES) of the gene sets “metabolic pathways” by gene set enrichment analysis (GSEA), comparing z scores of cell type–specific proteomes from P42 mice (AA, amino acid; FA, fatty acid; FDR, false discovery rate; OXPHOS, oxidative phosphorylation; PPP, pentose phosphate pathway; TCA, tricarboxylic acid cycle). (E) Heatmaps showing the mean cell type–specific abundance of proteins related to metabolic pathways (n = 4). (F) Cell type–specific abundance of mitochondrial proteins plotted as the relative abundance of each of the 274 identified mitochondrial proteins. (G) Violin plot of the density of mitochondria per cell soma volume, by quantification of SCOT+ mitochondria colabeled with cellular markers [n = 10 to 20 visual fields with 20 to 28 cells from four animals; one-way analysis of variance (ANOVA) with Tukey’s posttest showing significant differences to astrocytes, **P < 0.01 and ***P < 0.001]. (H) Violin plot of the relative mitochondrial volume (calculated from genetically labeled GFP fluorescence in the outer mitochondrial membrane) per cell soma volume in astrocytes (GFAP-Cre*MitoTag) and neurons (Rbp4-Cre*MitoTag) colabeled with cellular markers (n = 18 to 34 visual fields with 27 to 52 cells from three animals; Mann-Whitney test, ***P < 0.001). (I) Top five GO term processes of the 67 mitochondrial proteins found exclusively in astrocytes by overrepresentation analysis.

