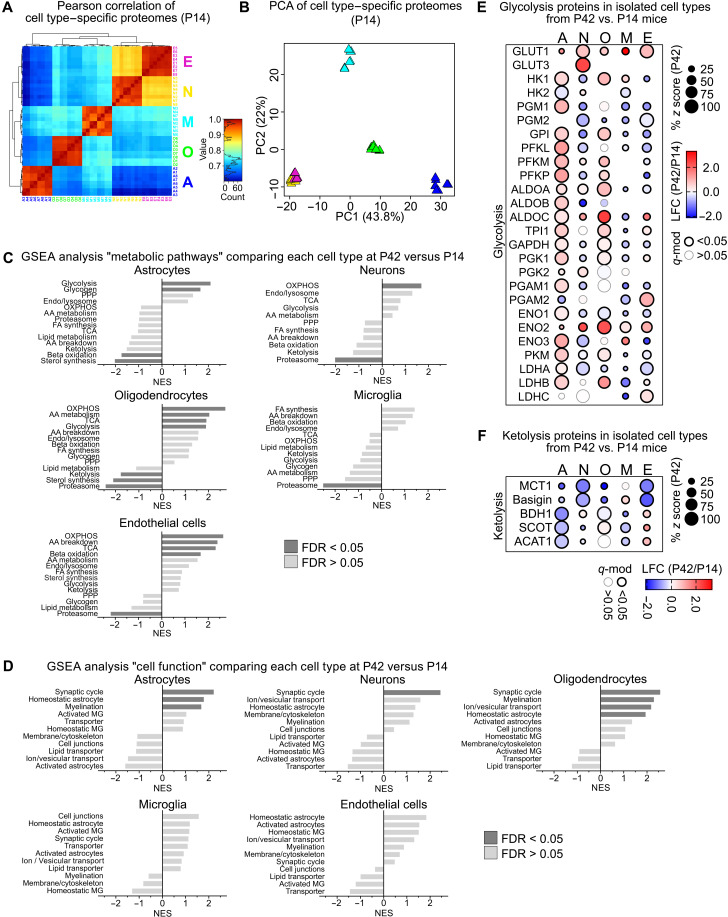
Fig. 2. Metabolic changes during postnatal brain maturation.
(A) Pearson correlation of cell type–specific proteome datasets from P14 mice comprising a total of 3787 proteins, ranging from 1770 proteins in oligodendrocytes to 2664 proteins in neurons. (B) PCA of cell type–specific proteomes from P14 mice calculated from 1144 complete cases. (C) NES of the gene sets “metabolic pathways” by GSEA, shown as log2 fold changes (LFC) of cell type–specific proteomes from P42 versus P14 mice. (D) NES of gene set “cell function” by GSEA, comparing LFC of cell type–specific proteomes from P42 versus P14 mice. (E) Bubble plot of proteins related to glycolysis showing percent z scores at P42 (size), LFC of P42 versus P14 (color) with significant differences marked by the outline (q-mod values from moderated t statistics with FDR-based correction for multiple comparisons). (F) Bubble plot of proteins related to ketolysis in isolated cell types showing the percent z scores, LFC with significant differences marked by the outline as in (E).

