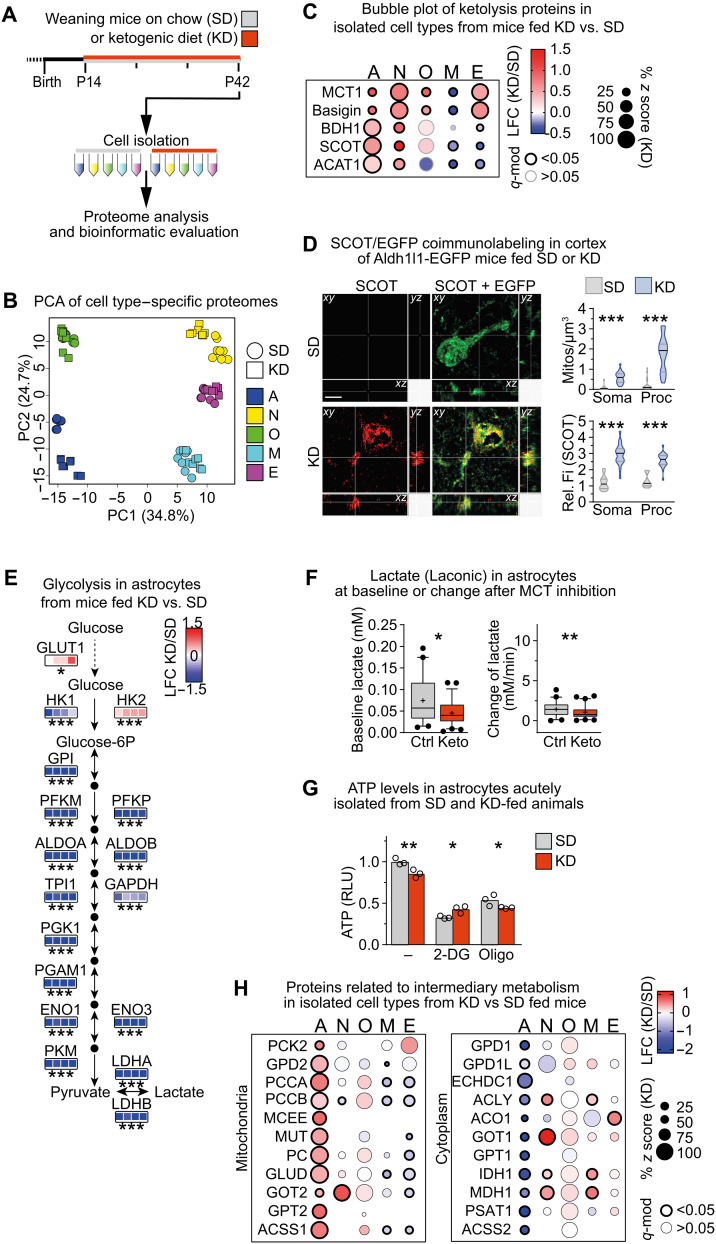
Fig. 4. Cell type–specific strategies of metabolic adaptations to feeding a KD.
(A) Experimental paradigm. (B) PCA of cell type–specific proteomes from mice fed SD or KD, calculated from 546 complete cases from a total of 3621 detected proteins. (C) Bubble plot of proteins related to ketolysis in isolated cell types from KD- versus SD-fed mice. (D) Maximum intensity projection (1-μm optical section in all dimensions) of SCOT (red) and enhanced green fluorescent protein (EGFP) (green) colabeling of brain sections from ALDH1L1-EGFP transgenes fed KD or SD with quantification of the density and relative fluorescence intensity (Fi) of SCOT+ mitochondria per volume in soma and processes (Mann-Whitney test, ***P < 0.001). ALDH1L1-EGFP mice express EGFP under the astrocyte Aldh1l1 promotor. Scale bar, 5 μm. (E) LFC of proteins related to glycolysis in astrocytes from mice fed KD versus SD (n = 4). (F) Median intracellular lactate levels (Laconic nanosensor) with 5 to 95 percentiles in astrocytes that had been exposed to SD-mimicking (5 mM glucose, Ctrl) or KD-mimicking (0.4 mM glucose and 4 mM 3HB, Keto) conditions for 1 week before measuring in 2 mM glucose, showing baseline lactate levels and the rate of lactate production after inhibiting MCT transporters (AR-C 155858) (n = 41 to 60 cells from three independent experiments; Mann-Whitney test, *P < 0.05 and **P < 0.01). (G) Mean intracellular ATP relative light units (RLU) with individual values in acutely isolated astrocytes from KD- and SD-fed animals, measured in 2 mM glucose with or without inhibition of glycolysis [2-deoxyglucose (2-DG)] or OXPHOS by oligomycin (Oligo) (n = 3 measurements pooled from two mice per group). (H) Bubble plot of proteins related to intermediary metabolism in cell types isolated from mice fed KD versus SD. (C, E, and F) Significant changes in protein abundance were determined by moderated t statistics with FDR-based correction for multiple comparisons (*q mod < 0.05, **q-mod < 0.005, and ***q-mod < 0.001).

