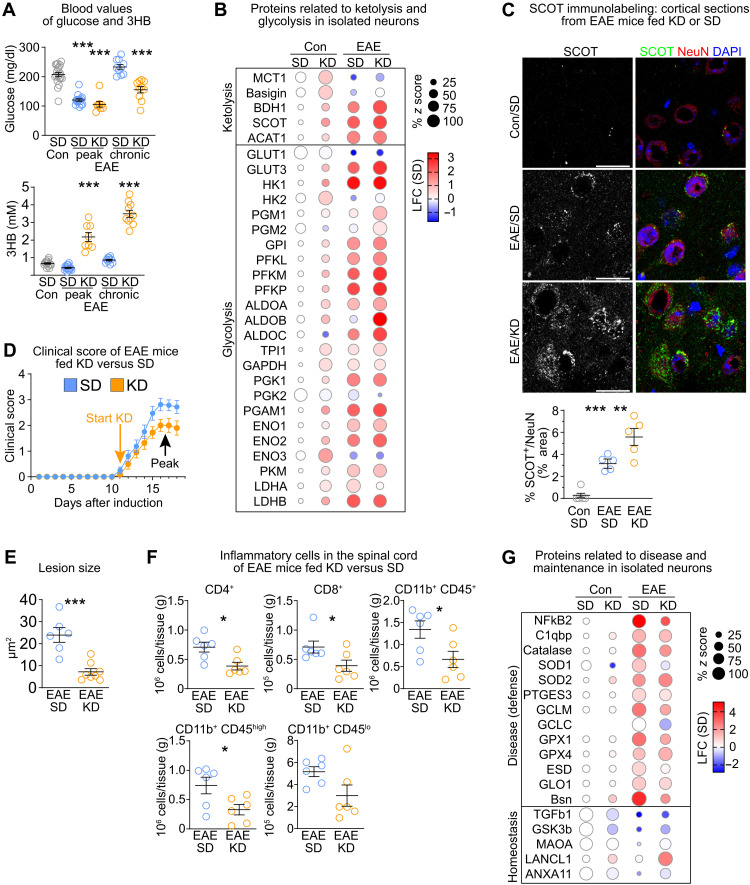
Fig. 6. Feeding KD supports neuronal metabolism in EAE.
(A) Mean blood glucose and 3HB with individual values of EAE mice fed SD or KD (n = 8 to 16 mice; one-way ANOVA with Dunnet’s posttest compared to control mice). (B) Bubble plot of ketolysis and glycolysis proteins in neurons from EAE mice and controls. (C) Representative immunolabeling of SCOT and NeuN in cortex of EAE mice and controls with quantification (n = 5 mice, one-way ANOVA with Tukey’s posttest; scale bars, 20 μm). (D) Mean clinical score ± SEM of EAE mice. KD was applied therapeutically starting with disease onset (n = 8 SD, n = 16 KD mice). (E) Mean lesion size ± SEM in lumbar spinal cord of EAE mice (n = 6 to 8 mice; unpaired two-sided Student’s t test). (F) Mean density of inflammatory cells ± SEM in spinal cord of EAE mice fed KD or SD analyzed by flow cytometry (n = 6 mice; unpaired two-sided Student’s t test). (G) Bubble plot of disease defense and homeostatic markers in cortical neurons from EAE mice and controls. *P < 0.05, **P < 0.01, and ***P < 0.001.

