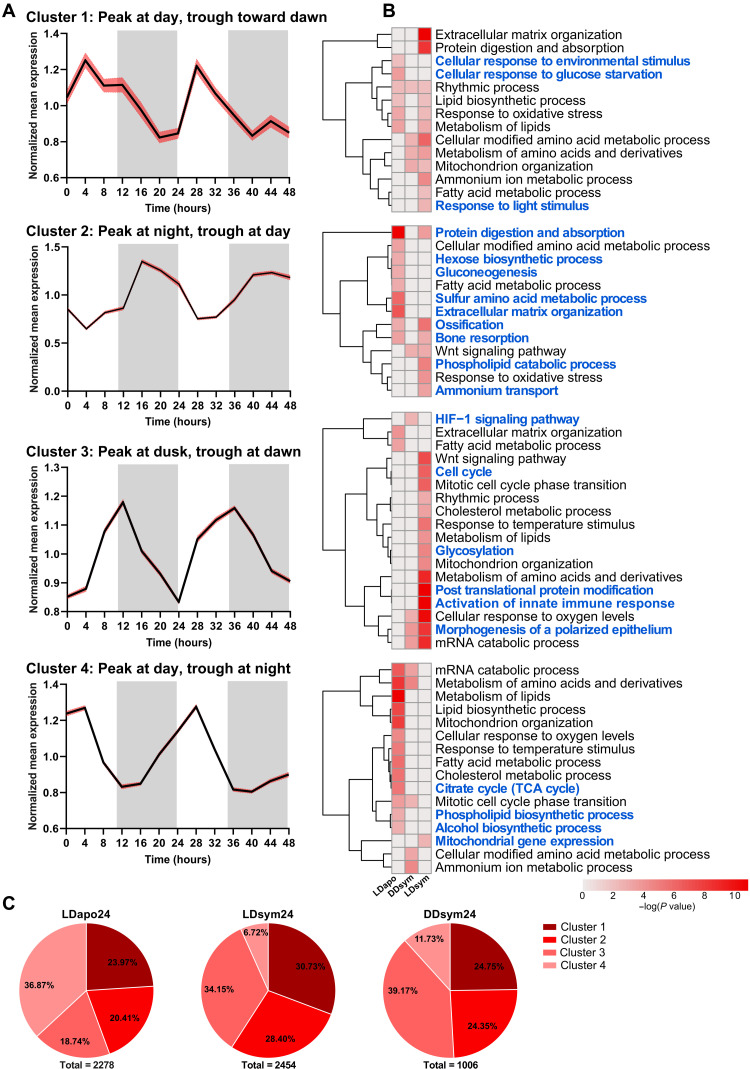
Fig. 2. Diel rhythmic gene clustering.
Gaussian mixture models (GMMs) clustering generated four diel gene clusters among the LDapo24, LDsym24, and DDsym24 subgroups. (A) Mean expression profiles (black lines) with 95% confidence interval (red shading) for each cluster over 48 hours. The profiles’ peak (maximum) and trough (minimum) expression characterize each cluster. White and gray shaded areas indicate the LD phases during the experimental time course. White indicates light or dark during subjective day and gray indicates dark. (B) Heatmaps showing significantly enriched ontology terms [GO biological processes, Kyoto Encyclopedia of Genes and Genomes (KEGG) pathway, Reactome gene sets, canonical pathways, CORUM (comprehensive resource of mammalian protein complexes), and WikiPathways] identified by Metascape. Each heatmap represents enriched terms across the three subgroup gene lists in a single cluster (top to bottom: clusters 1, 2, 3, and 4). Color scale represents −log10(P). Gray cells indicate the lack of enrichment for that term in the corresponding gene list. Blue text indicates terms found enriched in a single cluster. (C) Pie charts showing the distribution (percentages) of the rhythmic transcripts per cluster in each subgroup.

