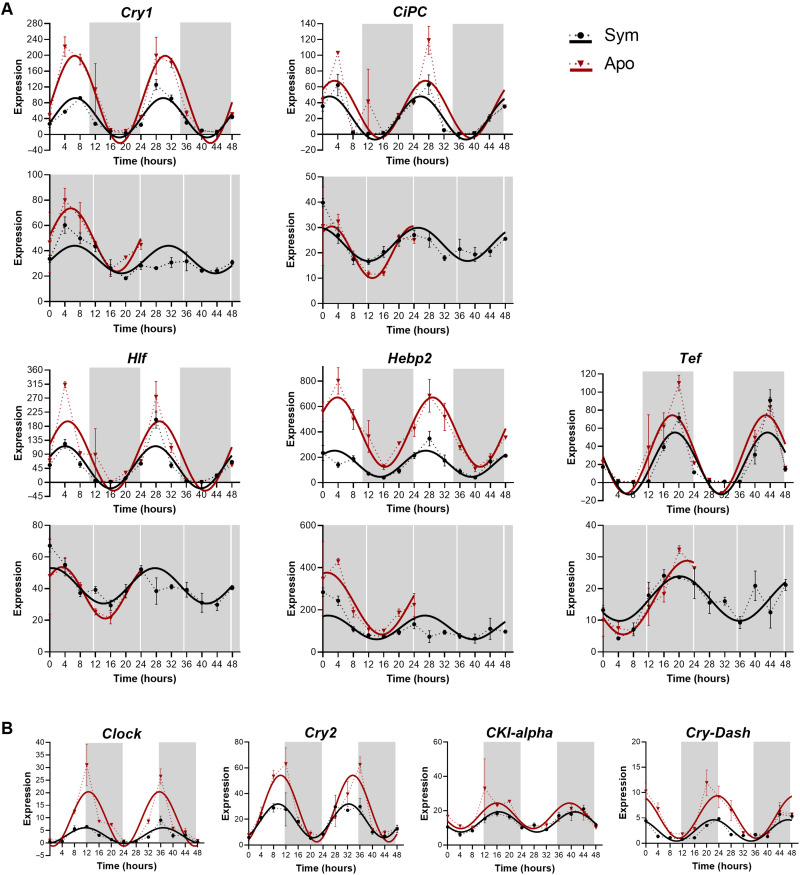
Fig. 4. Expression profiles of candidate circadian genes of E. paradivisa.
(A and B) Expression plots for candidate core-clock and clock-controlled genes cycling with a 24-hour period (RAIN P < 0.01) in symbiotic (black) and aposymbiotic (red) morphs. The x axis indicates the experimental time course (time 0 = sunrise and time 12 = 1 hour after sunset). White and gray shaded areas indicate light and dark, respectively. The y axis indicates the normalized expression levels. Note that the scales differ across plots. Data points are presented as mean values ± SEM (n = 3 biological replicates). Fitting curves (smooth lines) are based on sinusoidal function. (A) Each vertical set of plots represents a single gene’s expression under LD (top) and DD (bottom). (B) Each plot represents a single gene’s expression under LD.

