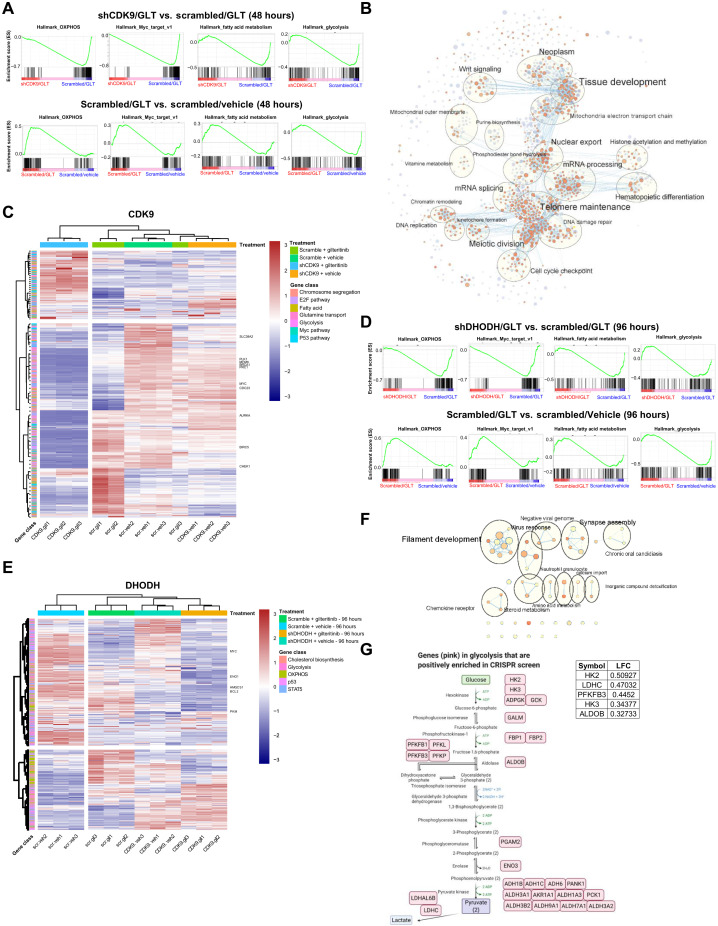
Fig. 4. Genetic inhibition of CDK9 or DHODH in combination with gilteritinib alters multiple signature pathways.
(A) GSEA plots of representative significantly down-regulated and up-regulated pathways in hallmark gene sets for shCDK9/gilteritinib versus scrambled/gilteritinib and scrambled/gilteritinib versus scrambled/vehicle comparisons. Combination treatment suppresses these pathways that are activated by gilteritinib treatment alone. (B) Cytoscape enrichment map of the top gene programs in shCDK9/gilteritinib combination. Enriched GSEA gene sets are predicted with Enrichment Map in Cytoscape and depicted by orange and purple nodes, where purple nodes represent significantly up-regulated pathways in combination treatment and orange nodes represent significantly down-regulated pathways in combination treatment. Node size is proportional to the number of genes in each node, line thickness indicates the overlap of genes between nodes, and the theme of genes in each cluster is specified. Clustered gene programs are labeled. (C) Heatmap showing normalized read counts of genes in selected top enriched pathways predicted by GSEA across different treatment groups of shCDK9-mediated synergy. Selected genes are labeled. The hierarchical clustering of genes and samples was performed with Euclidean distance matrix and Ward’s clustering method. (D) GSEA plots of representative significantly down-regulated and up-regulated pathways in hallmark gene sets for shDHODH/gilteritinib versus scrambled/vehicle and scrambled/gilteritinib versus scrambled/vehicle comparisons. Combination treatment suppresses these pathways that are activated by gilteritinib alone. (E) Heatmap showing normalized read counts of genes in selected top enriched pathways predicted by GSEA across different treatment groups of shDHODH-mediated synergy. Selected genes are labeled. The hierarchical clustering of genes and samples was performed with Euclidean distance matrix and Ward’s clustering method. (F) Cytoscape enrichment map of the top gene programs in shDHODH/gilteritinib combination. (G) Top glycolysis-related hits in positive selection of CRISPR screen upon gilteritinib treatment are highlighted in glycolysis pathway. Log(fold change) values of the top five hits are listed.

