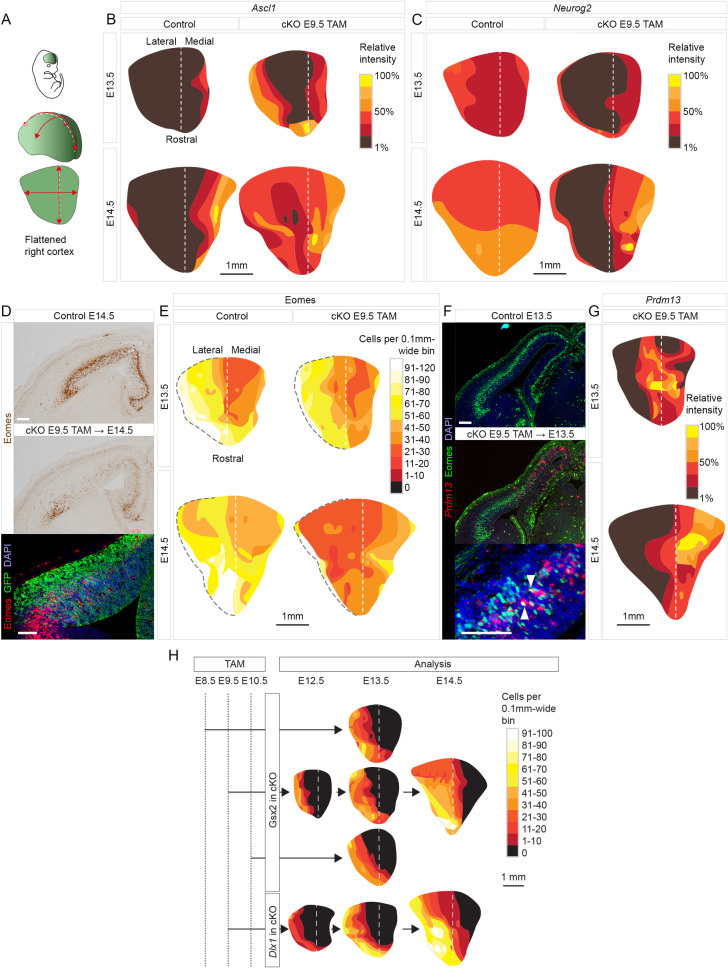
Fig 3. Distinct spatiotemporal patterns of gene expression changes in Pax6 cKO cortex.
(A-C) Flattened surface views of the cortex, oriented as in (A), to show the variation in the relative intensity of Ascl1 and Neurog2 staining across control and Pax6 cKO cortex at E13.5 and E14.5. Method in S8B Fig. (D) Colorimetric and fluorescence immunoreactivity for Eomes in control and Pax6 cKO cortex at E14.5 (with GFP labeling Emx1-lineage cells). Scale bars: 0.1 mm. (E) Flattened surface views of the cortex, oriented as in (A), to show the variation in the density of Eomes+ cells in control and Pax6 cKO cortex at E13.5 and E14.5. Dashed black line: pallial–subpallial boundary. (F) Immunoreactivity for Eomes and in situ hybridization for Prdm13 in control and Pax6 cKO cortex at E13.5. Arrowheads indicate double-labeled cells. Scale bars: 0.1 mm. (G) Flattened surface views of the cortex, oriented as in (A), to show the variation in the relative intensity of Prdm13 staining in Pax6 cKO cortex at E13.5 and E14.5. (H) Flattened surface views of the cortex oriented as in (A), showing the densities of Gsx2+ and Dlx1+ cells in control and Pax6 cKO cortex at E12.5, E13.5 and E14.5 following tamoxifen administration at E8.5, E9.5, or E10.5. GFP, green fluorescent protein; Pax6 cKO, Pax6 conditional knockout.

