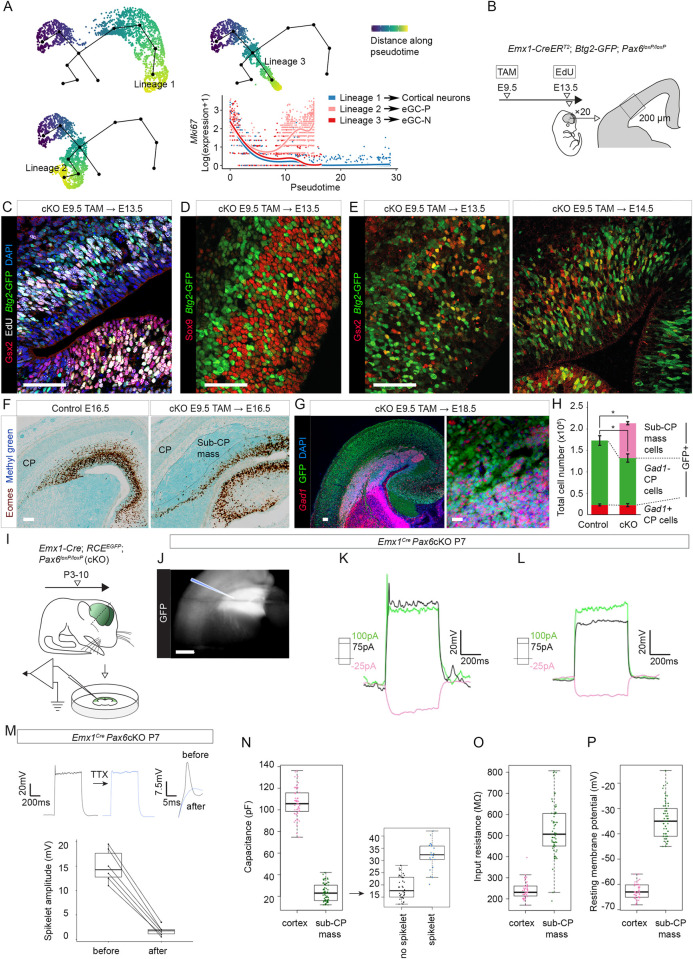
Fig 4. The proliferation, coalescence, and electrophysiological properties of Gsx2-lineage eGCs.
(A) Major pseudotemporal trajectories inferred from E14.5 Pax6 cKO scRNAseq data (one leading to eGC-Ps, one to eGC-Ns, and one to cortical glutamatergic neurons) and expression of the marker of proliferating cells, Mki67, along each. (B) The experimental procedure for EdU labeling. The Emx1-CreERT2 allele with tamoxifenE9.5 was used to delete Pax6 (embryos carried a Btg2-GFP transgene); EdU was given at E13.5, 30 min before death; 20 coronal sections equally spaced through the brain were immunoreacted for EdU, Gsx2, and GFP; counts were made in the boxed area. (C) Fluorescence quadruple-staining for Gsx2, EdU, GFP (marking Btg2-expressing cells), and DAPI in E13.5 Pax6 cKO cortex after the procedure in (B). Scale bar: 0.1 mm. (D) Fluorescence double-staining for Sox9 and GFP (marking Btg2-expressing cells) in E13.5 Pax6 cKO cortex after tamoxifenE9.5. Scale bar: 0.1 mm. (E) Fluorescence double-staining for Gsx2 and GFP (marking Btg2-expressing cells) in E13.5 and E14.5 Pax6 cKO cortex after tamoxifenE9.5. Scale bar: 0.1 mm. (F) Eomes immunoreactivity and methyl green counterstaining in control and E16.5 Pax6 cKO cortex after tamoxifenE9.5. Scale bar: 0.1 mm. (G) Fluorescence immunoreactivity for GFP (Emx1-lineage) and in situ hybridization for Gad1+ cells in E18.5 Pax6 cKO cortex after tamoxifenE9.5. Scale bars: 0.1 mm and 0.01 mm. (H) Quantifications of the total numbers of Gad1+ cells in the lateral CP (red: they were GFP-, subcortically derived), of Gad1− cells in the CP (green: GFP+, cortical-born) and of cells in the Pax6 cKO sub-CP masses (pink: Gad1+, GFP+) in control and Pax6 cKO E18.5 embryos after tamoxifen at E9.5 (for quantification method, see S11F Fig). Total numbers of cells were greater in Pax6 cKO cortex (p < 0.05) and numbers of lateral CP cells were reduced (p < 0.02) (averages ± SEM; Student paired t tests; n = 4 embryos of each genotype, from 4 independent litters) (S4 Data). (I) The experimental procedure for electrophysiology (J-P). The Emx1-Cre allele was used to delete Pax6; embryos carried a GFP reporter transgene. Recordings were from sub-CP masses at P3–10. (J) Sub-CP mass in P7 slice prepared for electrophysiology: The cortex was GFP+ and the sub-CP mass was intensely so. Scale bar: 0.5 mm. (K,L) Examples of responses of sub-CP mass cells to current injections (square steps, magnitudes color-coded, 500 ms duration). Membrane voltages were held at −70mV. Some cells produced small spikelets (J), others did not (K). (M) TTX (300 nM) reduced spikelet amplitudes; examples of entire response and spikelet alone before and after TTX application; effects of TTX were significant (p = 0.035, Wilcoxon signed rank test; n = 6 cells) (Sheet A in S5 Data). (N-P) Passive electrical properties of P3-P10 sub-CP mass cells compared to P5-P7 cortical cells from layer 5 of somatosensory area 1 (n = 66 sub-CP mass cells, Sheet B in S5 Data; n = 49 cortex cells, data for these CP cells are in S5 Table). Sub-CP mass cells had significantly lower capacitance (p = 2.2 × 10⁻¹⁶, Mann–Whitney test) and significantly higher input resistance (p = 2 × 10⁻¹⁰, Mann–Whitney test) and resting membrane potential (p = 2.2 × 10⁻¹⁶, Mann–Whitney test). For capacitance, values were significantly higher among sub-CP mass cells that produced spikelets (n = 22 cells; n = 44 produced no spikelet) (p = 1.9 × 10⁻⁹, Mann–Whitney test). CP, cortical plate; EdU, 5-ethynyl-2′-deoxyuridine; GFP, green fluorescent protein; Pax6 cKO, Pax6 conditional knockout; TTX, tetrodotoxin.

