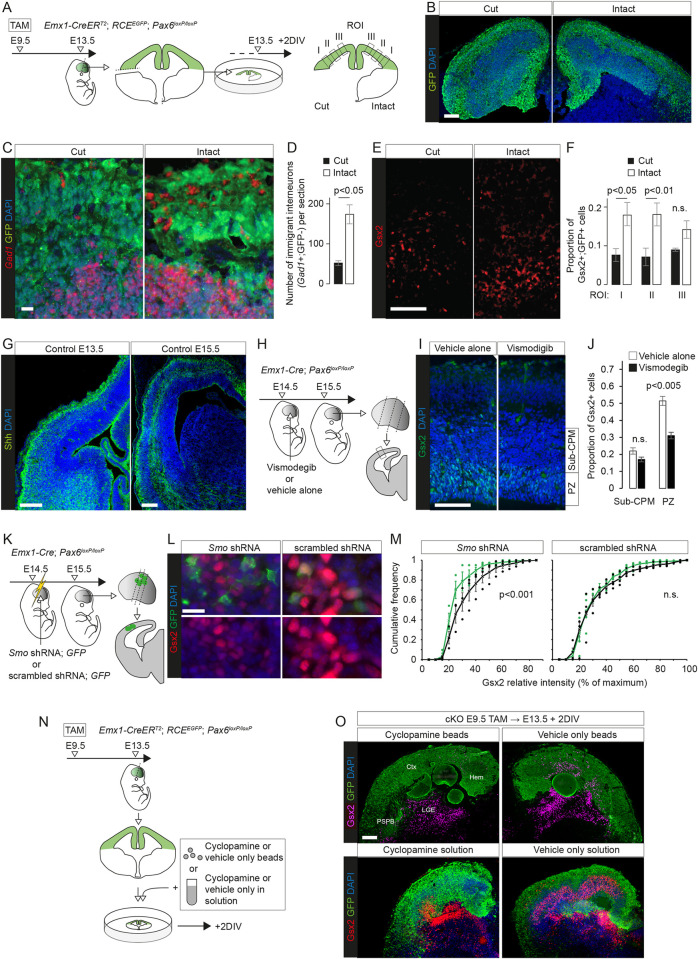
Fig 6. Extracellular signals promoted eGC production in Pax6 cKOs cortex.
(A) The experimental procedure for (B-F): TAM was given at E9.5 to generate Pax6 cKOs, with Cre-deleted cells expressing GFP; coronal slices were cultured on E13.5 with the ventral telencephalon removed on one side; after 2 DIV, sections from cultured slices were cut and processed. Gsx2+ GFP+ cells were counted in 3 ROIs on each side. (B, C) GFP immunoreactivity and in situ hybridizations for Gad1 in sections prepared as in (A). Scale bars: 0.1 mm and 0.01 mm. (D) Average (±SEM) numbers of immigrant Gad1+ interneurons (i.e., GFP nonexpressing) per section were lower on the side lacking ventral telencephalon (n = 3 independent cultures; Student paired t test) (Sheet A in S6 Data). (E) Gsx2 immunoreactivity in sections prepared as in (A). Scale bar: 0.1 mm. (F) Average (±SEM) proportions of GFP+ cells that were Gsx2+ in each ROI in (A) (n = 3 independent cultures; Student paired t tests; n.s., not significant) (Sheet B in S6 Data). (G) Immunoreactvity for Shh in control telencephalic sections at E13.5 and E15.5 (see S15B Fig for evidence of antibody specificity). Scale bar: 0.1 mm. (H) The experimental procedure for (I, J): Vismodegib or vehicle alone was injected into the ventricle of E14.5 Pax6 cKO embryos made using Emx1-Cre; central regions of lateral cortex from coronal sections at 3 rostral-to-caudal levels were analysed at E15.5. (I) Gsx2 immunoreactivity in boxed region in (H). Scale bar: 0.1 mm. (J) Average (±SEM) proportions of cells in the PZs and CPMs that were Gsx2+ (n = 5 embryos from 3 litters given vehicle alone; n = 6 embryos from 3 litters given vismodegib; Student t tests) (Sheet A in S7 Data). (K) The experimental procedure for (L, M): Constructs expressing Smo shRNA + GFP or scrambled shRNA + GFP were electroporated into the cortex of E14.5 Pax6 cKO embryos made using Emx1-Cre; electroporated cells were analysed at E15.5 (as in S15D Fig). (L) Gsx2 and GFP immunoreactivity in electroporated regions. Scale bar: 0.01 mm. (M) Cumulative frequency distributions of the intensity of Gsx2 immunoreactivity in electroporated cells (GFP+; green) and surrounding randomly selected non-electroporated cells (GFP−; black) for the 2 constructs (see Figs 6K and S15D) (n = 3 embryos from 3 litters given Smo shRNA; n = 4 embryos from 3 litters given scrambled shRNA; Kolmogorov–Smirnov tests) (Sheet B in S7 Data). (N) The experimental procedure for (O): TAM was given at E9.5 to generate Pax6 cKOs and Cre-deleted cells expressed GFP; coronal slices of telencephalon were cultured on E13.5; cyclopamine or vehicle alone were added either on beads or in solution (10 μM); slices were cultured for 2 DIV. (O) Sections from cultured slices obtained as in (N) were immunoreacted for Gsx2 and GFP. Scale bar: 0.1 mm. Ctx, cortex; DIV, day in vitro; GFP, green fluorescent protein; Hem, cortical hem; LGE, lateral ganglionic eminence; Pax6 cKO, Pax6 conditional knockout; PSPB, pallial–subpallial boundary; PZ, proliferative zone; ROI, region of interest; sub-CPM, sub-cortical plate mass; TAM, tamoxifen.

