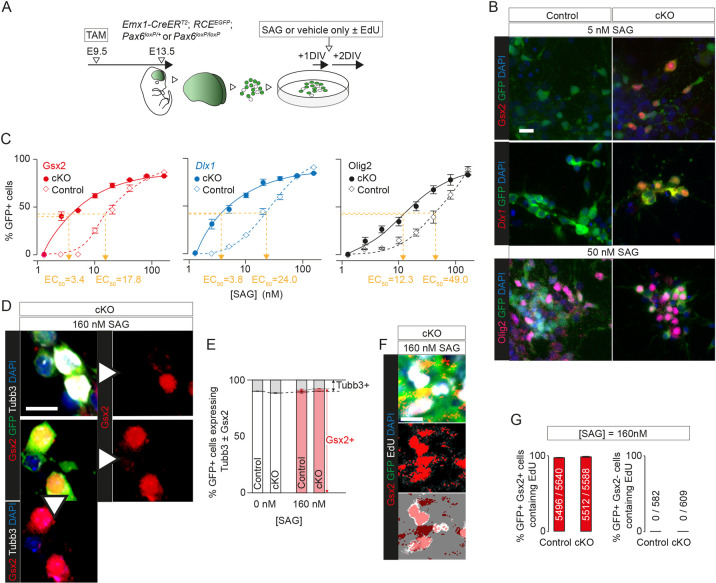
Fig 8. Pax6 deletion affected concentration-response of cortical cells to Shh pathway activation.
(A) The experimental procedure for (B-G): TAM was given at E9.5 to generate Pax6 cKO and control embryos, with Cre activation revealed by GFP expression; E13.5 cortex was dissociated, cells were treated with SAG or vehicle alone, and with EdU in some cases, after 1 DIV, and were analysed after a further 2 DIV. (B) Examples of labeling of E13.5 control and Pax6 cKO cells grown in dissociated culture with 5 nM or 50 nM SAG. Labeling was for DAPI and GFP with Gsx2, Dlx1, or Olig2. Scale bar: 0.01 mm. (C) Graphs of concentration-responses to SAG (measured as percentages of GFP+ cells expressing Gsx2, Dlx1, or Olig2). Data are averages (±SEM; n = 3 independent experiments each), with EC50s for each response curve. Two-way analyses of variance were conducted. For Gsx2: significant effects of genotype (f(1,32) = 798.9, p < 0.001) and SAG concentration (f(7,32) = 1,138, p < 0.001) and significant interaction effect (f(7,32) = 123.5, p < 0.001). For Dlx1: significant effects of genotype (f(1,32) = 763.6, p < 0.001) and SAG concentration (f(7,32) = 1,011, p < 0.001) and significant interaction effect (f(7,32) = 91.90, p < 0.001). For Olig2: significant effects of genotype (f(1,32) = 177.4, p < 0.001) and SAG concentration (f(7,32) = 415.1, p < 0.001) and significant interaction effect (f(1,32) = 15.88, p < 0.001) (Sheets A-C in S8 Data). (D) Examples of labeling of E13.5 control and Pax6 cKO cells grown in dissociated culture with 160 nM SAG. Labeling was for DAPI, GFP, Gsx2, and Tubb3. Examples include GFP+ cells that were Gsx2+, Tubb3−; Gsx2+, Tubb3+; Gsx2−, Tubb3+. Scale bar: 0.01 mm. (E) Average percentages (±SEM; n = 4 independent experiments each) of GFP+ control or Pax6 cKO cells with or without 160 nM SAG that expressed Tubb3, Gsx2, or both (Sheet D in S8 Data). (F) Examples of labeling of E13.5 control and Pax6 cKO cells grown in dissociated culture with 160 nM SAG. Labeling was for DAPI, GFP, and EdU. Examples include GFP+ cells that were Gsx2+, EdU+; Gsx2+, EdU−. Scale bar: 0.01 mm. (G) Average percentages (±SEM; n = 4 independent experiments each) of GFP+ cells that contained EdU among the Gsx2+ and Gsx2− populations in cultures from control and Pax6 cKO cortex treated with SAG. Total numbers, across all cultures, of GFP+ cells that contained EdU over total numbers of GFP+ cells are stated for each condition (Sheet E in S8 Data). DIV, day in vitro; EdU, 5-ethynyl-2′-deoxyuridine; GFP, green fluorescent protein; Pax6 cKO, Pax6 conditional knockout; SAG, signaling agonist; TAM, tamoxifen.

