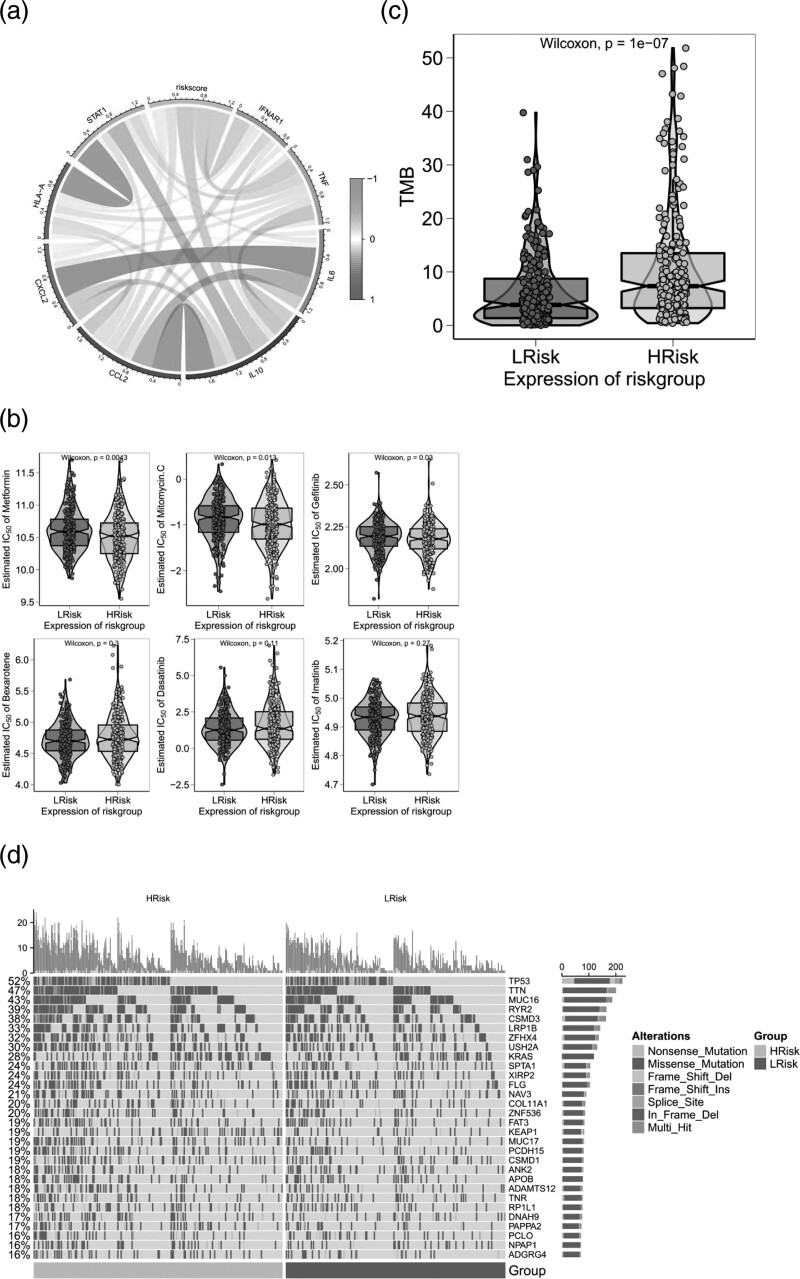
Fig. 4.
ROC analysis of the prognostic model. (a) the ROC curve related to TCGA training set model (1-2-3 years). (b) the ROC curve related to TCGA test set model (1-2-3 years), and the clinical predictive value of the model explored in multiple omics studies; (c) Correlation between risk score and tumor immune invasion; (d–g) Correlation between risk score and ESTIMATES, Stromal, ImmuneImmune, checkpoint.

