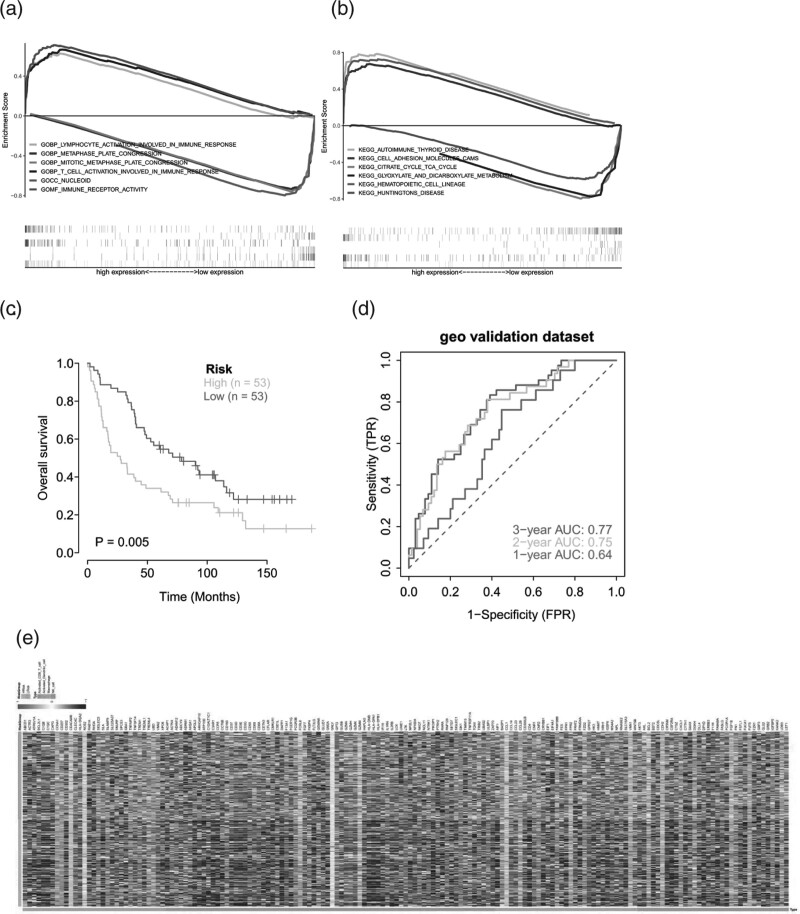
Fig. 6.
GSEA pathway analysis between high and low risk groups. (a) GSEA-Go enrichment analysis related to high and low risk groups; (b) GSEA-KEGG enrichment analysis related to high and low risk groups. External data sets verify the predictive efficacy of risk models; (c) Kaplan–meier curves of GEO external data sets; (d) ROC curve of GEO external data set in 1-2-3; (e) Immunoregulation factor analysis: heat map of expression of immunoregulation related genes in the high and low-risk groups.

