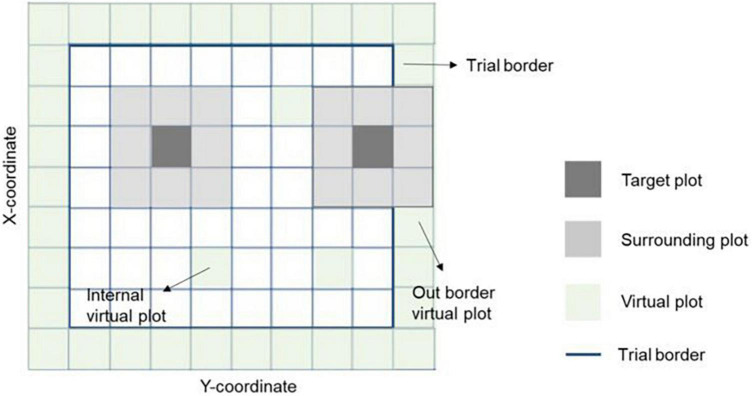
FIGURE 2.
Representation of spatial information in a field trial. The target and eight surrounding plots were used together to correct the spatial variability across the field. The trial borders’ effect was considered by adding virtual plots to complete the eight surrounding plots for all observations. Virtual plots were also added in empty X-Y coordinates (with no plot observation registered) to ensure all plots have the eight surrounding plots. Hence, the spatial effects on an individual plot is the sum of effects with the square centered on the plot itself plus the effects of the eight surrounding plots with a square centered on those plots.

