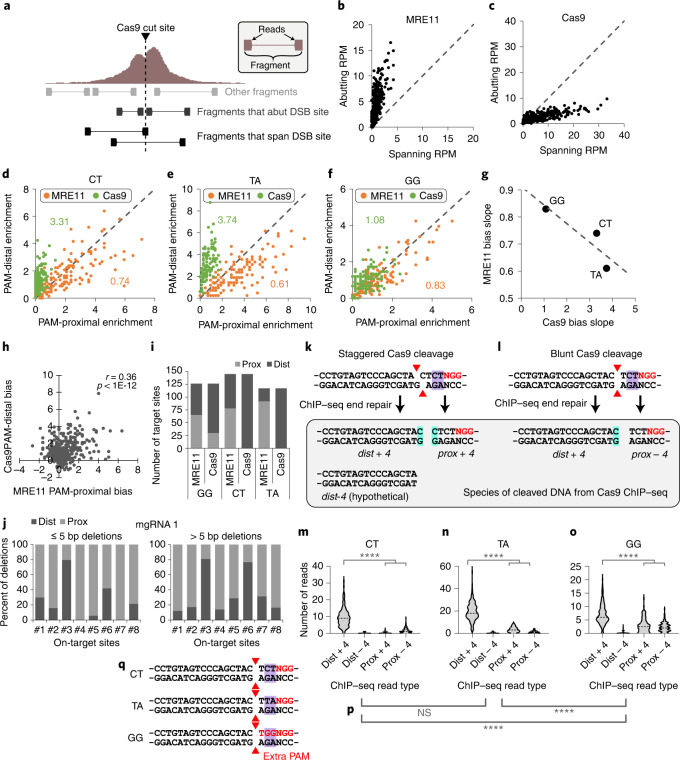
Fig. 3. Analysis of Cas9 cleavage features from ChIP–seq data.
a, Conceptual schematic of ChIP–seq analysis for PE reads, distinguishing between read fragments that abut or span the DSB site. Reads abut the DSB site if they fall within 5 bp from the cut site. b,c, Number of PE reads (RPM) that either span or abut each target site for MRE11 (b) and Cas9 (c) ChIP–seq. d–f, For each ‘CT’ (d), ‘TA’ (e) and ‘GG’ (f) mgRNA on-target site, RPM on the PAM-proximal versus PAM-distal side for MRE11 (orange) versus Cas9 (green) ChIP–seq 3 h after Cas9 delivery. The numbers indicate linear regression slopes. g, MRE11 and Cas9 slopes from d–f are inversely correlated. h, For each target site, we plotted the MRE11 PAM-proximal bias versus Cas9 PAM-distal bias. PAM-proximal bias is defined as RPM on the PAM-proximal side minus RPM on the PAM-distal side, and vice versa for PAM-distal bias. Correlation was determined using Pearson correlation with its P value. i, For MRE11 and Cas9 ChIP–seq using the ‘GG’, ‘CT’ or ‘TA’ mgRNAs, we plot the number of on-target sites with PAM-proximal (‘prox’, light grey) or PAM-distal (‘dist’, dark grey), bias. j, For cells exposed to 10 days of Cas9 with mgRNA from in Fig. 1l, we determined all possible deletions from high-throughput amplicon sequencing data at select on-target sites (1, 2, …, on x-axis). For deletions ≤5 bp or >5 bp, we determined whether the deletion occurs more on the PAM-proximal or PAM-distal side. k,l, Schematic of Cas9 cleavage scenarios for the ‘CT’ target sequence. Two possibilities for Cas9 cleavage (staggered versus blunt) are displayed, with red triangles annotating the cleavage position at each DNA strand. ChIP–seq end repair fills in nucleotides at the 3′ end, resulting in three possible read species: dist + 4: immediately PAM-distal, containing fourth nucleotide from PAM (+4 nucleotide); prox + 4: immediately PAM-proximal containing +4 nucleotide; prox − 4: immediately PAM-proximal lacking +4 nucleotide. A fourth, hypothetical species is included for completeness: dist − 4: immediately PAM-distal lacking +4 nucleotide. The +4 nucleotide is highlighted in cyan. m–o, Violin plot of the number of reads, for each Cas9 target site, categorized by the four read types (dist + 4, dist − 4, prox + 4 and prox − 4) described above. Comparison between dist + 4 and sum of prox + 4 and prox − 4 using two-sided unadjusted Student’s t-test. ****P < 0.0001. P values are: 3 × 10−80, 3 × 10−57 and 3 × 10⁻¹⁶ for CT, TA and GG, respectively. p, Two-sided unadjusted Student’s t-test of significance for the number of PAM-proximal reads (prox + 4 + prox − 4) between different gRNA sequences. NS, not significant, ****P < 0.0001. P values from left to right are: 0.35, 2.6 × 10⁻²² and 6.6 × 10⁻¹⁹. q, Schematic of the ‘CT’, ‘TA’ and ‘GG’ sequences, which differ only in the most PAM-proximal two nucleotides (highlighted in purple). The ‘GG’ target sequence has an extra PAM. ‘NGG’ PAM(s) are labelled in red. The blunt-end cleavage possibility is displayed with red triangles annotating the cleavage position. Source numerical data are available in source data.

