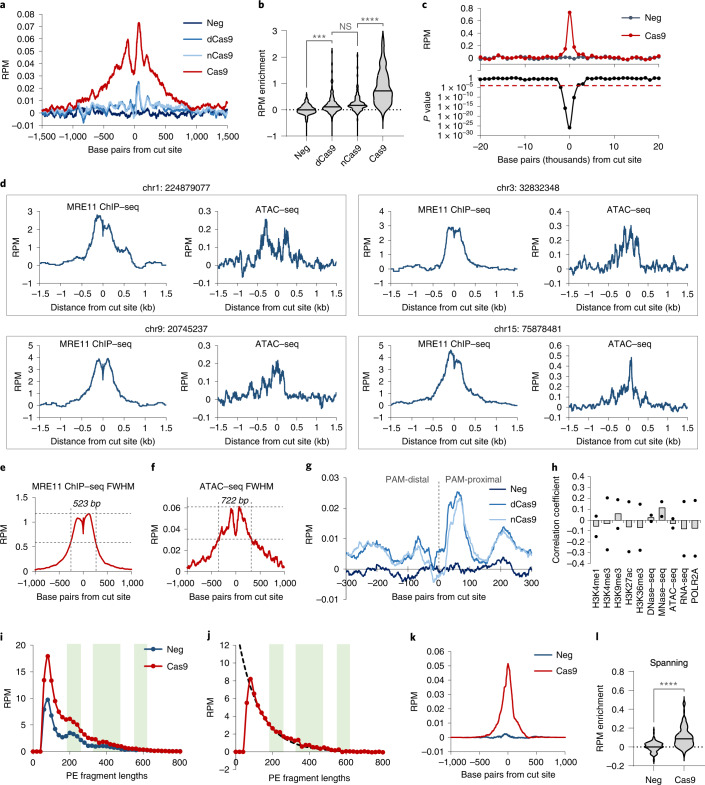
Fig. 5. Chromatin accessibility change after DNA damage.
a, Averaged background-subtracted ATAC–seq profiles across all on-target sites for cells without Cas9 (‘neg’, dark blue); or 3 h after Cas9/‘GG’-gRNA (‘Cas9’, red), dCas9/’GG’ (‘dCas9’, medium blue) or D10A Cas9 nickase/’GG’ delivery (‘nCas9’, light blue). ‘Background-subtracted’ enrichment was obtained by subtracting the number of reads at each position for Cas9-negative cells from Cas9-exposed cells, yielding enrichment values that quantify ‘excess’ accessibility due to Cas9 exposure. b, Violin plots of background-subtracted ATAC–seq enrichment (in RPM) at each target site for samples from a. Comparison using two-sided unadjusted Student’s t-test. ***P < 0.001, ****P < 0.0001. P values from left to right are: 0.00027, 0.072 and 8.77 × 10⁻¹⁴. c, Top: average background-subtracted ATAC–seq enrichment (RPM) in 1 kb windows moving upstream and downstream of all cut sites, for cells without Cas9 (neg), or 3 h after Cas9/‘GG’–gRNA delivery (Cas9). Bottom: two-sided Student’s t-test P values of difference in enrichment between ‘neg’ and ‘Cas9’ samples in each 1 kb window. d, MRE11 ChIP–seq and background-subtracted ATAC–seq signals at four representative cut sites. The genomic coordinate (hg38) of the cut sites are displayed on top of each panel. e,f, Measurement of FWHM for MRE11 ChIP–seq enrichment (523 bp) versus MRE11 enrichment (722 bp) averaged across all on-target cut sites. g, Close-up of averaged background-subtracted ATAC-seq profiles across all on-target sites for cells without Cas9 (‘neg’, darkest blue), dCas9 (‘dCas9’, medium blue) and D10A Cas9 nickase (‘nCas9’, light blue). Zoomed view of a. h, Correlation between ten epigenetic markers and MRE11-normalized excess ATAC–seq enrichment due to Cas9-mediated DNA damage. n = 2 biologically independent experiments. i, Histogram of ATAC–seq DNA lengths for cells without Cas9 (‘neg’, blue), or 3 h after Cas9/‘GG’-gRNA delivery (‘Cas9’, red). j, Subtraction of the ‘Cas9’ sample by ‘neg’ sample from j. Fitting (black dotted curve) was performed using an exponential decay model. k,l, Same as a and b, for cells without Cas9 (‘neg’, dark blue) or 3 h after Cas9/‘GG’–gRNA delivery (‘Cas9’, red), but only measuring the subset of ATAC–seq reads that span the cut site. Comparison using two-sided unadjusted Student’s t-test. ****P < 0.0001. P value is 1.44 × 10⁻¹⁸. Source numerical data are available in source data.

