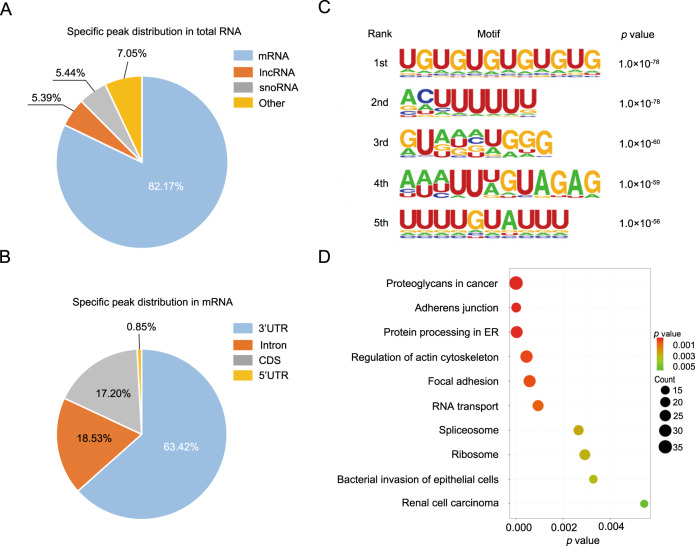
Fig. 2. Extensive RNA targets of PURα in ESCC cells were revealed by CLIP-seq analysis.
A The distribution of 2299 specific peaks bound by PURα in total RNA is shown in the pie diagram. B The distribution of 1889 specific peaks bound by PURα in mRNA is shown in the pie diagram. C Motif enrichment analysis was performed with the HOMER algorithm to determine the PURα binding sequence preference. The top 5 motifs are shown. D GO analysis was implemented with DAVID based on PURα-bound mRNA. The top 10 enriched pathways are shown.

