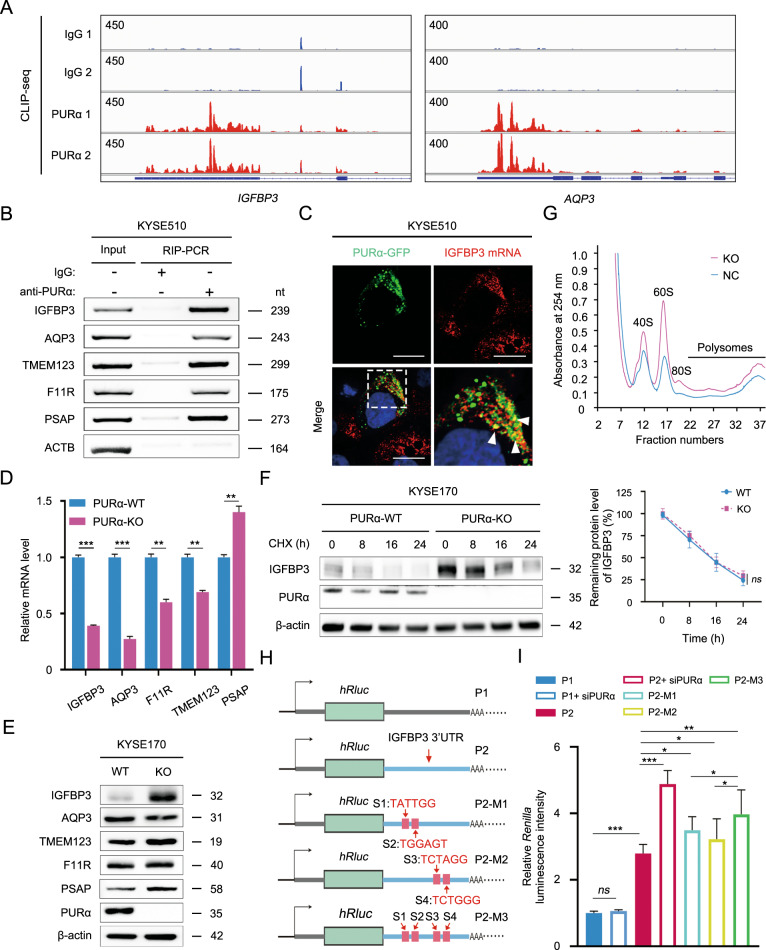
Fig. 3. PURα inhibits IGFBP3 protein expression by binding to its 3’UTR.
A Genome browser views of specific peaks bound by PURα in CLIP-seq were visualized with IGV software. The y-axis indicates the reads per million (RPM) value for the highest peak within the genome browser field for each CLIP-seq run. The annotated RefSeq gene structures are shown in blue, with thin horizontal lines indicating introns and thicker blocks indicating exons. B A RIP assay followed by PCR was performed to determine the interaction between PURα and the mRNAs of candidate genes in KYSE510 cells. Specific primers were designed according to the RNA sequences bound by PURα in CLIP-seq. ACTB is a negative control. The results are representative of at least three independent experiments. Nt: nucleotide. C The interaction between PURα and IGFBP3 mRNA 3’UTR was visualized using an RNA FISH assay in KYSE510 cells. Scale bars: 30 μm. D A qPCR assay was performed to examine the mRNA expression levels of candidate genes in wild-type and PURα-deficient KYSE170 cells. Representative data are presented as the mean ± SEM from three independent experiments. E The protein levels of candidate genes were assessed via western blotting in wild-type (WT) and PURα-deficient KYSE170 (KO) cells. F The effect of PURα on the protein stability of IGFBP3 was detected in PURα-wild type (WT) and PURα-deficient (KO) KYSE170 cells. WT and KO cells were treated with cycloheximide (CHX) for 0, 8, 16 and 24 h, and the protein level of IGFBP3 was determined by western blot analysis. Representative data are presented from three independent experiments. β-actin, loading control; Ns, not significant. G Plot of the absorbance profile of fractions obtained through sucrose gradients to isolate polysomes from KYSE170-WT and KYSE170-KO cells. Peaks and curves indicate the binding of RNA to the marked units of ribosomes or polysomes. H Schematic diagram of the psiCHECK™-2 luciferase reporter constructs containing the negative control sequence (P1) or 3’UTR of IGFBP3 mRNA with wild (P2) or mutation (P2-M1, P2-M2 and P2-M3). S1, S2, S3 and S4 indicate the mutated sites in the 3’UTR of IGFBP3 mRNA. The sequence of IGFBP3 3’UTR and mutation is shown in Fig. S3. I The relative Renilla luciferase activity of P1, P2, P2-M1, P2-M2 and P2-M3 was monitored in KYSE510 cells with or without PURα knockdown using siRNA. The Renilla luciferase data were normalized to firefly luciferase data. In all experiments mentioned above, the representative data are presented from at least three independent experiments. Ns not significant; *p < 0.05; **p < 0.01; ***p < 0.001.

