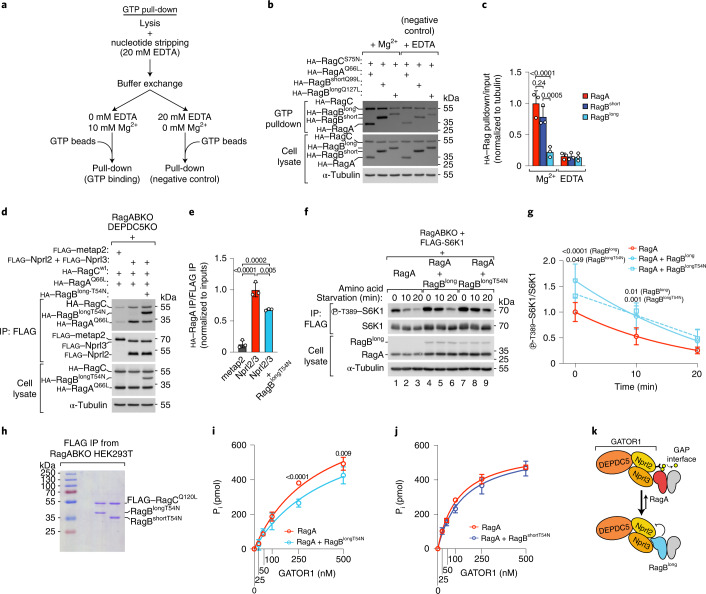
Fig. 4. RagBlong acts as a ‘sponge’ for the GAP interface of GATOR1.
a, Schematic representation of the GTP pull-down assay. b,c, GTP pull-down of RagA, RagBshort or RagBlong in the presence of magnesium or with addition of 20 mM EDTA as negative control: representative example (b) and quantification of three independent experiments, with RagA Mg2+ set to 1 (c). Bar height indicates average, and error bars represent standard deviation; n = 3 biological replicates. Two-way ANOVA and Sidak’s post-hoc test. d,e, Co-IP of Nprl2 and Nprl3 with Rag dimers consisting of wild-type RagC and GTP-locked RagA (Q66L) expressed with or without non-GTP-bound (T54N) RagBlong. The experiment was performed using RagA/B and DEPDC5 triple-knockout cells to assess specifically the binding to the GAP interface of GATOR1: representative example (d) and quantification of three independent experiments, with the Nprl2/3 condition set to 1 (e). Bar height indicates average, and error bars represent standard deviation; n = 3 biological replicates. One-way ANOVA and Tukey’s post-hoc test. f,g, S6K1 phosphorylation in RagABKO cells transiently transfected with RagA either alone or together with wild-type RagBlong or a non-GTP-bound mutant of RagBlong (T54N) during amino-acid starvation (amino-acid-free DMEM + 10% dFBS): representative example (f) and quantification of six independent experiments, with RagA-expressing cells at timepoint 0 set to 1 (g). Circle/square indicates average, and error bars represent standard deviation; n = 6 biological replicates. Two-way ANOVA and Tukey’s post-hoc test. h, Coomassie staining of RagBlongT54N and RagBshortT54N proteins purified from RagABKO HEK293T cells as dimers with FLAG-tagged RagCQ120L (1 μg dimer per lane). The experiment was repeated once. i,j, Malachite-green GTPase assay with 1 μM of RagA•RagCS75N either alone or mixed with an equimolar amount of RagBlongT54N•RagCQ120L (i) or RagBshortT54N•RagCQ120L (j) in solution in the presence of the indicated amounts of GATOR1. Quantification of four (i) or three (j) independent experiments. Circle indicates average, and error bars represent standard deviation; n = 3 (j) and 4 (i) replicates. Two-way ANOVA and Sidak’s post-hoc test. k, Schematic representation of the mechanism whereby non-GTP-bound RagBlong titrates away the GAP interface of GATOR1. Exact P values are shown in the graphs. Source numerical data and unprocessed blots are available in source data.

