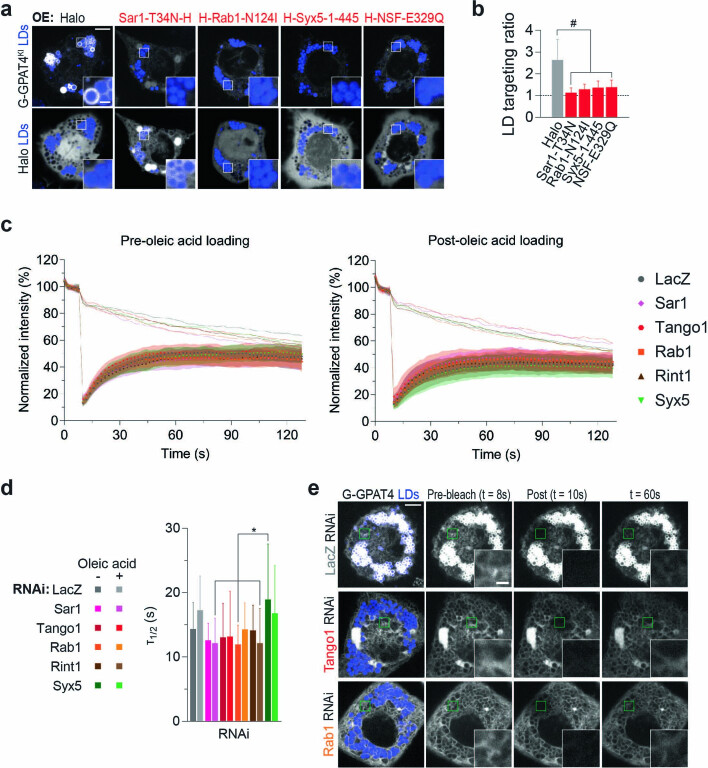
Extended Data Fig. 4. Depletion of ERES components, membrane-fusion regulator, tether, and SNAREs does not affect GPAT4 diffusion in the ER.
a, Expression of dominant-negative Sar1, Rab1, Syx5, and NSF mutants impairs GPAT4 targeting to LDs. Confocal imaging of live EGFP-GPAT4 endogenous knock-in cells upon transient transfection with Halo tagged constructs. H = Halo tag. Scale bar, 5 and 1 μm (inlay). b, Bar graph showing LD targeting ratios from the imaging experiment in a. Mean ± SD, n = (left to right) 60, 44, 46, 45, 40 cells examined over 3 independent experiments. One-way ANOVA with Bonferroni correction, #p < 0.0001. c, FRAP experiment of stably overexpressed EGFP-GPAT4 in the ER upon RNAi of LacZ, Sar1, Tango1, Rab1, Rint1, or Syx5 prior to or 20 h after 1 mM oleic acid treatment. Photobleaching at t = 8 s. Symbols indicate mean normalized intensities within the bleached region. SD is shown in transparent colors around the mean values. Solid lines above show mean normalized intensities outside the bleached region within the cell. d, Tau values for fluorescence recovery are comparable in all RNAi conditions pre- or post-oleic acid loading. Mean ± SD, n = 18 cells from 3 experiments. One-way ANOVA with Bonferroni correction, *p < 0.05 (from left to right: 0.0124, 0.0155, 0.0153). e, Representative images for the FRAP experiment in c, d. Green squares indicate the photobleached region. Scale bar, 5 and 1 μm (inlay). See also Supplementary Video 1. Source numerical data are available in source data.

