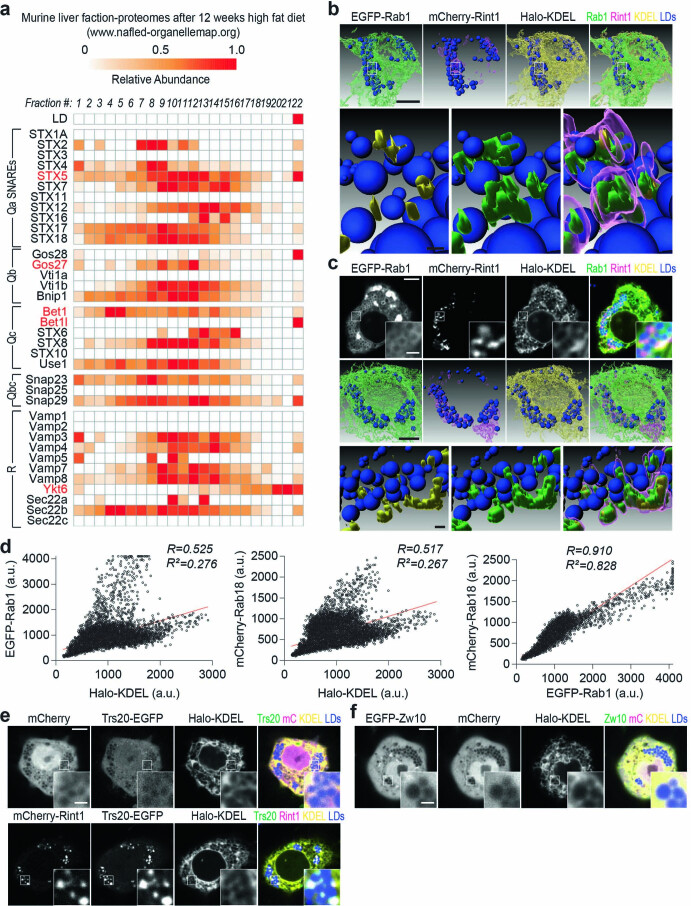
Extended Data Fig. 6. Rab1, Rint1, and specific SNAREs associate with LDs.
a, Specific SNAREs are enriched in the LD fraction of murine fatty liver [data mined from nafld-organellemap.org52]. In this study, mice were subjected to 12 weeks of high-fat diet. Their livers were harvested and separated into 22 fractions using a sucrose gradient, and proteomes of the fractions were analyzed with mass spectrometry. First row shows the organellar migration pattern for LDs based on protein correlation profiling. SNAREs are classified according to their classes, and the predicted orthologs of SNAREs required for late ER-to-LD protein targeting (Syx5, membrin, Bet1, and Ykt6) are highlighted in red. b, Additional 3D reconstruction images for Fig. 3g, h. For the inlay images at the bottom, blue indicates LDs, yellow indicates regions of mCherry-Rint1 overlapping with ER marker (Halo-KDEL), green indicates regions of mCherry-Rint1 overlapping with LD surface and ER (EGFP-Rab1), and magenta indicates mCherry-Rint1. Scale bar, 5 and 1 μm (inlay). c, Additional example of 3D reconstruction experiment shown in b. Scale bar, 5 and 1 μm (inlay). d, Cytofluorograms between overexpressed tagged Rab1, Rab18, and KDEL (ER marker) for images shown in Fig. 3f. High R value suggests strong correlation between Rab1 and Rab18 intensities compared to between Rab1 and KDEL or between Rab18 and KDEL. R2 values, as well as the regression line (red), are indicated. e, Overexpressed Rint1 recruits Trs20 to LDs. Localization of transiently co-transfected Trs20-EGFP and mCherry-Rint1 with respect to LDs. Representative images from 3 independent experiments are shown. Scale bar, 5 and 1 μm (inlay). f, Overexpressed Zw10 does not associate with LDs, in contrast to Rint1. Localization of transiently transfected EGFP-Zw10 with cytosolic (mCherry) and ER (Halo-KDEL) markers, with respect to LDs that were stained with MDH. Representative images from 3 independent experiments are shown. Scale bar, 5 and 1 μm (inlay). Source numerical data are available in source data.

