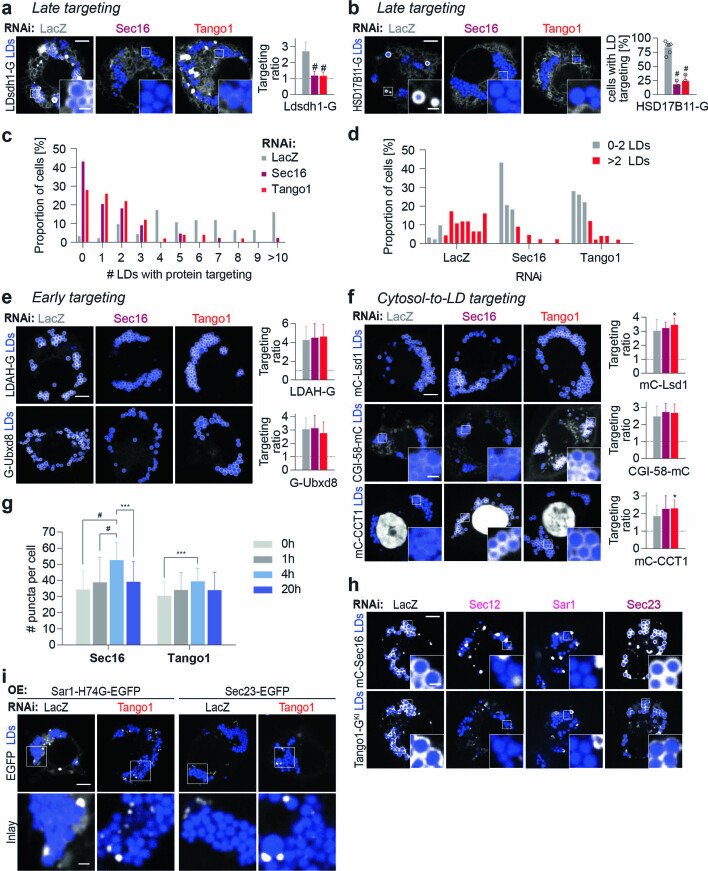
Extended Data Fig. 7. ERES increase in number upon LD induction and are required for late ER-to-LD protein targeting.
a, Sec16 and Tango1 are required for LD targeting of Ldsdh1. Confocal imaging of wildtype cells upon RNAi of ERES components, followed by transient transfection with Ldsdh1-EGFP and a 20-hr incubation in oleate-containing medium. Scale bar, 5 and 1 μm (inlay). Mean ± SD, n = (left to right) 79, 41, 52 cells examined over 3 independent experiments. One-way ANOVA with Bonferroni correction, #p < 0.0001, compared to LacZ. b, Sec16 and Tango1 are required for LD targeting of HSD17B11. Scale bar, 5 and 1 μm (inlay). Bar graph shows percentage of cells with LD targeting (defined as those with >2 LDs with protein targeting). Mean ± SD, n = 3 experiments except 6 for LacZ RNAi (14–17 cells each). One-way ANOVA with Bonferroni correction, #p < 0.0001, compared to LacZ. c, d, Bar graph showing percentage of cells for a given number of LDs with HSD17B11-EGFP targeting upon RNAi of ERES components. Representative images in b. e, f, Sec16 and Tango1 are dispensable for LD targeting of (e) LDAH and Ubxd8 and (f) Lsd1, CGI-58, and CCT1. Scale bar, 5 and 1 μm (inlay). For mCherry-CCT1, nuclear signal was excluded from the calculation. Mean ± SD, n = (left to right) LDAH 87, 36, 36; Ubxd8 85, 44, 43; Lsd1 79, 39, 41; CGI-58 74, 36, 38; CCT1 54, 26, 31 cells examined over 3 independent experiments. One-way ANOVA with Bonferroni correction, *p < 0.05 (from top to bottom: 0.0159, 0.0193), compared to LacZ. g, LD induction transiently increases the number of Sec16 and Tango1 puncta. Representative images in Fig. 4e. Mean ± SD, n = (left to right) 38, 39, 33, 37; 38, 39, 35, 37 cells examined over 2 independent experiments. One-way ANOVA with Bonferroni correction, ***p < 0.001 (from left to right: 0.0001, 0.0008), #p < 0.0001. h, Localization of Sec16 around LDs and its recruitment of endogenous Tango1 require Sec12 and Sar1 but not Sec23. Representative images from 3 independent experiments are shown. Scale bar, 5 and 1 μm (inlay). i, Overexpressed Sar1-H74G and Sec23 accumulate around LDs upon Tango1 depletion. Representative images from 5 independent experiments are shown. Scale bar, 5 and 1 μm (inlay). Source numerical data are available in source data.

