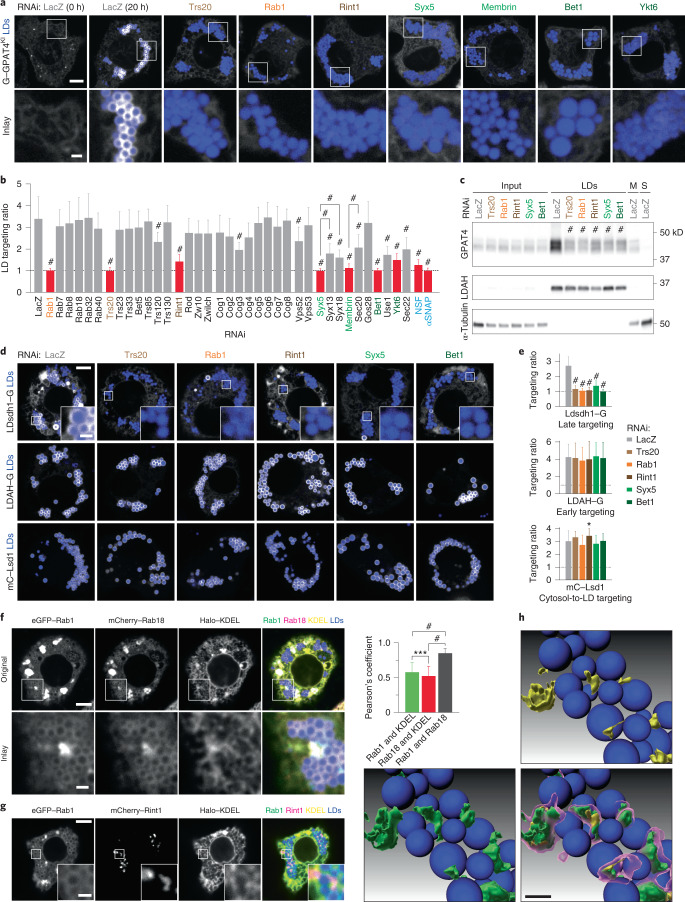
Fig. 3. A membrane-fusion regulator, a tether and SNAREs are required for late ER-to-LD protein targeting.
a, Depletion of specific Rab, membrane-tethering complex components and SNAREs abolished endogenous GPAT4 targeting to LDs. Confocal imaging of eGFP–GPAT4KI cells upon RNAi of membrane-fusion machinery components, followed by a 20-h incubation in oleate-containing medium. Scale bars, 5 μm and 1 μm (inlay). b, Quantification of a and Extended Data Fig. 2a. Mean ± s.d., n = (left to right) 59†; 31†, 19, 21, 45†, 19 and 18; 26†, 31†, 32†, 18, 30, 38† and 33†; 20, 29, 18 and 19; 19, 20, 17, 19, 19, 20, 19 and 18; 23†, 20; 27† 29† and 25†; 18, 37† and 20; 43†, 18; 24† and 22†; 17† and 30† cells examined over two or three† independent experiments. Red: knockdowns that abolish GPAT4 targeting to LDs on imaging. One-way ANOVA with Bonferroni correction, #P < 0.0001, compared with LacZ unless otherwise indicated. c, Depletion of specific Rab, membrane-tethering complex components and SNAREs reduces GPAT4 amount in LD fractions. Western blot analysis of wild-type cell fractions upon RNAi and LD induction. Left: protein target. Right: ladder positions. M, membranes; S, soluble fraction. GPAT4 band intensities in LD fractions: LacZ (1.00), Trs20# (0.34 ± 0.06), Rab1# (0.28 ± 0.03), Rint1# (0.37 ± 0.04), Syx5# (0.35 ± 0.03) and Bet1# (0.38 ± 0.04) (mean ± s.d., n = 3). One-way ANOVA with Bonferroni correction, #P < 0.0001 compared with LacZ. d, Depletion of specific Rab, membrane-tethering complex components and SNAREs impairs LD targeting of Ldsdh1 but not of LDAH or Lsd1. Scale bars, 5 μm and 1 μm (inlay). e, Quantification of d. Mean ± s.d., n = (left to right; top to bottom) 79, 48, 48, 45, 49, 45; 87, 36, 36, 39, 34, 40; 79, 36, 31, 33, 31, 33 cells examined over three independent experiments. One-way ANOVA with Bonferroni correction, *P = 0.0469, #P < 0.0001, compared with LacZ. f, Localization of transiently expressed eGFP–Rab1, mCherry–Rab18, and Halo–KDEL with respect to LDs. Scale bars, 5 μm and 1 μm (inlay). Right: Pearson’s correlation coefficient of intensities between two channels. Mean ± s.d., n = 23 cells examined over three independent experiments. One-way ANOVA with Bonferroni correction, ***P = 0.0001, #P < 0.0001, compared with LacZ. g, Localization of transiently expressed eGFP–Rab1, mCherry–Rint1 and Halo–KDEL with respect to LDs. Representative images from three independent experiments are shown. Scale bars, 5 μm and 1 μm (inlay). h, Three-dimensional reconstruction of images from g. mCherry–Rint1 puncta co-localizes with LD surface and ER. Blue: LDs; magenta: mCherry–Rint1; yellow: overlap between mCherry–Rint1 and ER (Halo–KDEL); green: overlap between mCherry–Rint1 and LD surface (eGFP–Rab1). See also Extended Data Fig. 6b,c. Scale bar, 1 μm. Source numerical data and unprocessed blots are available in source data.

