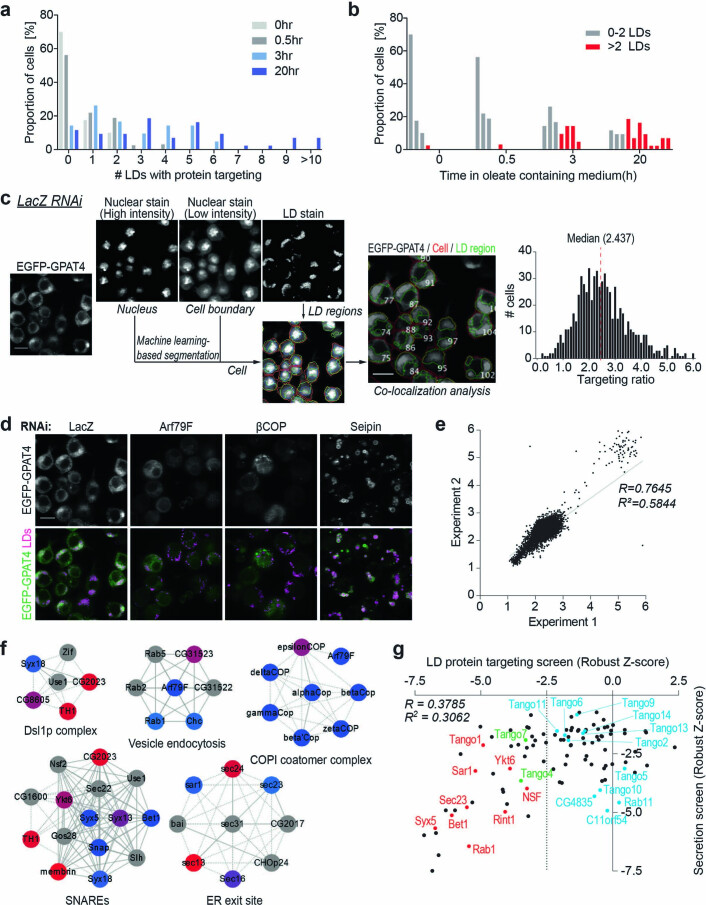
Extended Data Fig. 1. HSD17B11 targeting to LDs and an imaging screen to identify factors required for GPAT4 targeting to LDs.
a, b, Bar graph showing percentage of cells for a given number of LDs with HSD17B11-EGFP targeting over time after 1 mM oleic acid treatment. Representative images in Fig. 1b. c, Schematic diagram for LD targeting ratio calculation in the imaging screen. Sample images for LacZ RNAi are shown. Machine learning is used to segment individual cells and regions of LDs from the nuclear and LD stains, which are superimposed onto EGFP-GPAT4 channel to calculate LD targeting ratio for each cell. Median value from all segmented cells in eight different fields is reported as the final readout. Scale bars, 10 μm. d, Representative images for screen controls. LacZ RNAi has no effect on GPAT4 targeting to LDs, whereas Arf79F and βCOP RNAi reduce and Seipin RNAi increase GPAT4 targeting to LDs. n = 528 for LacZ RNAi; n = 132 for βCOP, Arf79F, and Seipin RNAi. Scale bar, 10 μm. e, Genome-scale screen is reproducible. Scatter plot showing targeting ratios from two independent genome-scale experiments. Grey: linear regression. f, Protein complexes enriched among hits required for GPAT4 targeting to LDs (robust Z-score < −2.5) using COMPLEAT37. Blue to red nodes: lowest to highest robust Z-scores; grey node (non-hits, robust Z-score > −2.5). Solid line: known interaction in Drosophila; dashed line: known interaction in other species. Permutation test as compared to 1000 random complexes of the same size, p-value < 0.01 for all complexes shown. g, Comparison of robust Z-scores between the LD protein targeting screen and the secretion screen38. In the secretion screen, the effect of genome-scale dsRNA library on the HRP secretion of Drosophila S2 cells was measured using chemiluminescence. Dotted line at robust Z-score < −2.5 for LD protein targeting screen hits. Red: select genes that are hits in both screens and characterized further in this study; green: other genes that are hits in both screens; blue: secretion screen hits that are not LD targeting screen hits. Source numerical data are available in source data.

