Fig. 1.
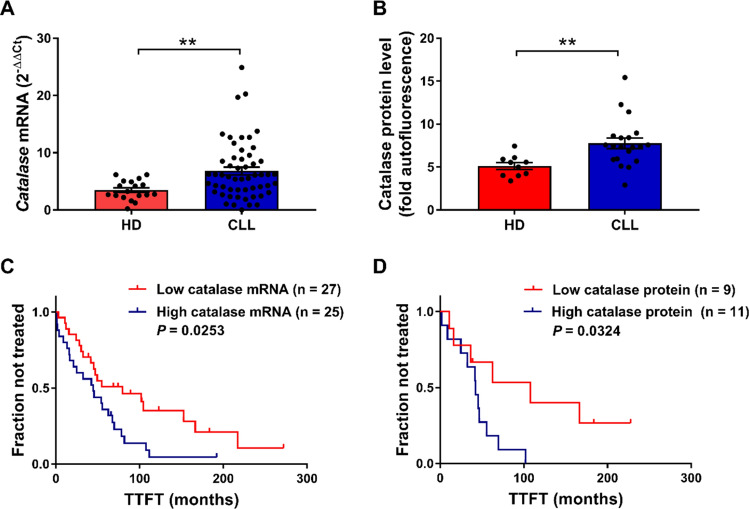
CAT expression level and its association with TTFT in CLL. A CAT mRNA levels in B cells purified from HD (n = 18) compared with B cells purified from CLL samples (n = 54). Data are expressed as relative quantification using comparative Ct method (2–ΔΔCt) and normalized to the expression value of the human embryonic kidney 293 cell line (HEK293) set as 1. B CAT protein expression in HD (n = 10) compared with CLL B-cell samples (n = 20). Data are expressed as fold autofluorescence calculated as median fluorescence intensity (MFI) divided by fluorescence-minus-one (FMO). Data are reported as mean ± SEM. Comparisons were performed with Mann Whitney test. **P < 0.01. C Kaplan–Meier curves of TTFT for subgroups of CLL patients distinguished by low (n = 27) and high (n = 25) CAT mRNA levels. D Kaplan–Meier curves of TTFT for subgroups of CLL patients distinguished by low (n = 9) and high (n = 11) CAT protein levels. High and low CAT expression values for both mRNA and protein were referred to the median expression values. Difference between the two curves was calculated with log-rank test. TTFT time to first treatment, HD healthy donor, CLL chronic lymphocytic leukemia

