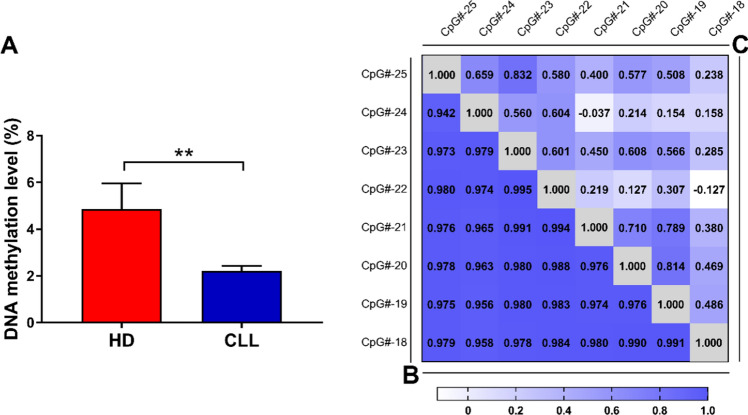
Fig. 4.
Methylation levels of CAT promoter region in HD and CLL B cells. A Methylation levels of the analyzed CAT promoter in HD B cells (n = 10) compared with CLL cells (n = 21). DNA methylation levels were measured as mean among the analyzed sites. Data are expressed as mean ± SEM. Comparison was performed with Student t test. **P < 0.01. B and C Correlation matrices showing pairwise Pearson correlations of methylation status among the 8 CpG sites within the promoter region of human CAT gene in HD (B) and CLL B cells (C). HDs healthy donors, CLL chronic lymphocytic leukemia

