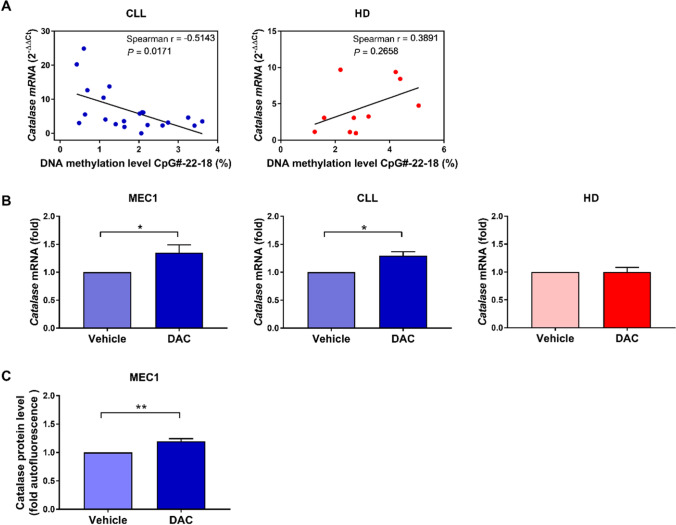
Fig. 5.
Association between methylation levels and CAT mRNA expression levels. A Association of DNA methylation percentage of sites CpG#22 to CpG#18 with CAT mRNA expression in CLL (n = 21) and HD B cells (n = 10). B MEC1 cells (6 experimental replicates), primary CLL cells (n = 7; CC = 4, CT = 2, ND = 1), and HD B cells (n = 3) were treated with 2 μM DAC or left untreated (vehicle) for 96 h and then analyzed for CAT mRNA levels. Data are expressed as relative quantification using comparative Ct method (2–ΔΔCt), normalized to the expression value of the human embryonic kidney 293 cell line (HEK293) set as 1, and reported as mean ± SEM of 5 independent experiments. C MEC1 cells were treated with 2 μM DAC or left untreated (vehicle) for 96 h and then analyzed for CAT protein levels. Data are expressed as fold autofluorescence calculated as median fluorescence intensity (MFI) divided by fluorescence-minus-one (FMO) and reported as mean ± SEM of 9 independent experiments. Comparisons were performed with Wilcoxon matched-pairs signed rank test. *P < 0.05. CLL chronic lymphocytic leukemia, HDs healthy donors, DAC 5-aza-2’-deoxycytidine, ND not defined for rs1001179 SNP

