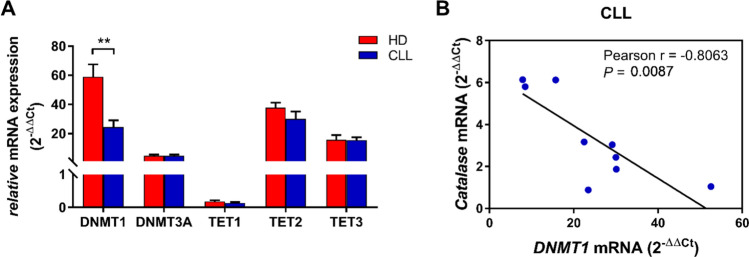
Fig. 6.
DNMTs and TETs expression levels in HD and CLL B cells. A DNMTs and TETs mRNA levels in HD B cells (n = 9) compared with CLL samples (n = 9). Data are expressed as relative quantification using comparative Ct method (2–ΔΔCt) and normalized to the expression value of the human embryonic kidney 293 cell line (HEK293) set as 1. Data are reported as mean ± SEM. Comparisons were performed with Unpaired t test. **P < 0.01. B DNMT1 mRNA expression correlated to CAT mRNA expression (n = 9). DNMTs DNA methyl transferases 1, TETs ten-eleven translocation, HD healthy donor, CLL chronic lymphocytic leukemia

