Figure 3.

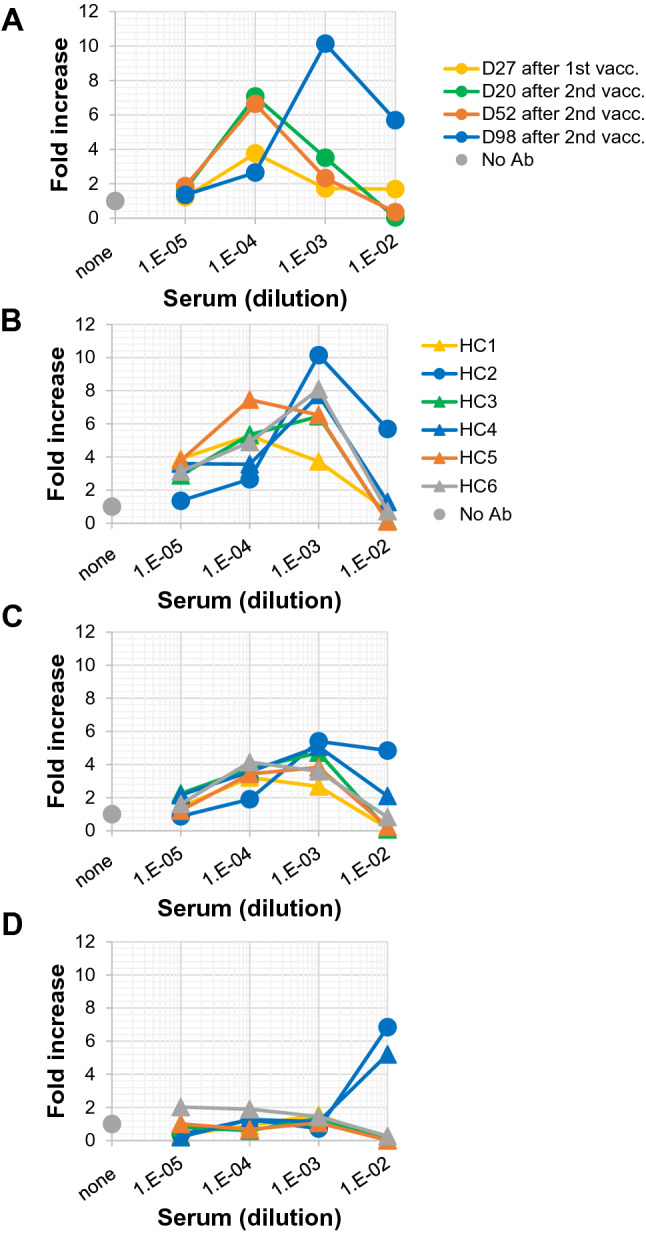
ADE potential in sera collected from mRNA-vaccinated volunteers. (A) Clone 35 cells (2 × 10⁴/well in a 96-well flat plate) were cultured with SARS-CoV-2 (original strain, 4 × 10³ copies/μL) in the presence (N = 3) or absence (N = 3–6, control culture) of serially-diluted sera from the same individual (HC2). Sera were collected at different time points after the first vaccination (on day 27) and second vaccination (on days 20, 52, and 98) as indicated in the insert. (B–D) Sera were collected on day 98 (B), day 133 (C), and day 175 (D) after the second vaccination from six healthy control volunteers (HC1-6, see insert in (B)) and added to the cultures as in (A). Three days later, the amount of virus in culture SNs was measured by qPCR. The increase of virus progeny in SNs is expressed as the fold increase compared with the amount of viruses cultured in the absence of serum on a linear scale (this figure) or log scale (Supplemental Fig. 6).
